

【RCI3 Three-Line + BODSOR】 Buy on dips / Sell on rallies signal; verify common patterns on yesterday's USD/JPY 1-minute chart
RCI Three-LineandBODSORUsage Examples
One of the features of the three-line RCI (RCI9, RCI26, RCI52) is
“When the three RCI lines are aligned in the same direction, the price movement in that direction tends to be larger.”
There is such a point.
If RCI26 and RCI52 are rising (falling) while RCI9 is falling (rising),
if RCI9 reverses,“the three RCIs align in the same direction”would be the case.
Therefore, detecting when RCI9 will reverse is very important.
(Case by case, but simply waiting for RCI9 reversal to be confirmed often leads to significant delays.)
To detect as early as possible the timing when the upward (downward) momentum of RCI9 weakens
, BODSOR was developed.
The figure below shows yesterday’s (March 16, 2018) 1-minute chart of USD/JPY.
USD/JPY 1-Minute
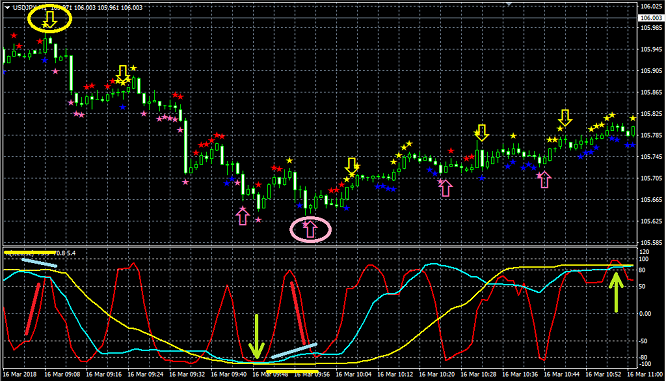
Upper row:BODSOR
Lower row: RCI Three-Line (red: RCI9, light blue: RCI26, yellow: RCI52)
(1) Sell-on-rally signal (yellow circle)
Only RCI9 among the three lines is rising.
If RCI9 reverses downward, all three RCIs may align downward.
In other words, the price could move strongly downward.
In this situation,BODSOR’s sell-on-rally signal (yellow arrow) lights up.
Immediately after the BODSOR signal lights, two bearish candles appear in succession. Since price continues to fall afterward, this case shows the sell-on-rally signal functioning well.(Subsequently, it has dropped to a three-time bottom for RCI3.)(2) Buy-on-dip signal (pink arrow surrounded by a circle)Among the three RCI lines, the only one clearly declining is RCI9.If RCI9 reverses upward, all three RCIs may align upward.In other words, the price could rise strongly.In this situation,BODSOR’s buy-on-dip signal (pink arrow) lights up.After the BODSOR signal lights, three consecutive bullish candles form, and price continues to rise, so in this case the signal functions well as a buy-on-dip signal.(Subsequently, it rises to a triple top on RCI3.)After the above sell-on-rally and buy-on-dip signals, as shown below, there is another instance where only RCI9 among the three lines rises, and a further sell-on-rally signal lights up again. Indicator showing Buy-on-Dip and Sell-on-Rally signals【BODSOR】Twitterhttps://twitter.com/RCIX3LineBloghttp://bodsor.blog.fc2.com/
(Subsequently, it has dropped to a three-time bottom for RCI3.)
(2) Buy-on-dip signal (pink arrow surrounded by a circle)
Among the three RCI lines, the only one clearly declining is RCI9.
If RCI9 reverses upward, all three RCIs may align upward.
In other words, the price could rise strongly.
In this situation,BODSOR’s buy-on-dip signal (pink arrow) lights up.
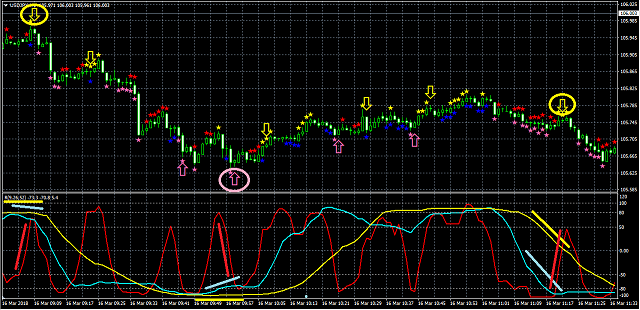
After the BODSOR signal lights, three consecutive bullish candles form, and price continues to rise, so in this case the signal functions well as a buy-on-dip signal.(Subsequently, it rises to a triple top on RCI3.)After the above sell-on-rally and buy-on-dip signals, as shown below, there is another instance where only RCI9 among the three lines rises, and a further sell-on-rally signal lights up again. Indicator showing Buy-on-Dip and Sell-on-Rally signals【BODSOR】Twitterhttps://twitter.com/RCIX3LineBloghttp://bodsor.blog.fc2.com/
(Subsequently, it rises to a triple top on RCI3.)
After the above sell-on-rally and buy-on-dip signals, as shown below, there is another instance where only RCI9 among the three lines rises, and a further sell-on-rally signal lights up again.
Indicator showing Buy-on-Dip and Sell-on-Rally signals【BODSOR】
Twitter
https://twitter.com/RCIX3Line
Blog
http://bodsor.blog.fc2.com/


