

【RCI3 Three-line + BODSOR】 Dow futures Daily chart Buy on dip / Sell on rally signal
RCI 3-lineandBODSORusage examples
One of the characteristics of the three-line RCI (RCI9, RCI26, RCI52) is
“When the three RCIs line up in the same direction, the price movement in that direction tends to be stronger”
this is often the case.
If RCI26 and RCI52 are rising (falling) and RCI9 is falling (rising),
when RCI9 reverses“the three RCIs line up in the same direction”will be the result.
Therefore, sensing when RCI9 will reverse becomes extremely important.
(Case by case, but simply waiting for the reversal of RCI9 to be confirmed often leads to significant lag.)
To detect as early as possible the moment when the momentum of RCI9's rise (fall) weakens, BODSOR was developed.
The diagram below is a daily chart of Dow futures from the end of last year to this year.
Dow Futures Daily
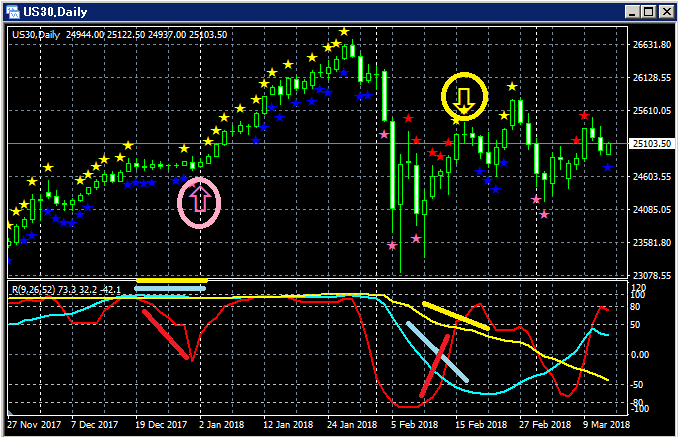
Top: BODSOR
Bottom: RCI 3-line (Red: RCI9, Light Blue: RCI26, Yellow: RCI52)
(1) Buy on dip signal (pink arrow)
Among the three RCI lines, only RCI9 is clearly declining.
If RCI9 reverses upward, there is a possibility that all three lines rise together.
In other words, price may also experience a strong rise.
In this kind of situationBODSOR’s buy-on-dip signal (pink arrow) lights up.
After the BODSOR signal lights up, four consecutive bullish candles appear, and the price continues to rise afterward, so this case demonstrates a well-functioning buy-on-dip signal.(2) Sell on rally signal (yellow arrow)Among the three RCI lines, only RCI9 is rising.If RCI9 reverses downward, all three lines may turn downward.In other words, price may fall strongly.In such a situationBODSOR’s sell-on-rally signal (yellow arrow) lights up.After the BODSOR signal lights up, following the same line, three consecutive bearish candles occurso, in this case it functions well as a sell-on-rally signal..Indicator displaying Buy on Dip / Sell on Rally signals [BODSOR]Twitterhttps://twitter.com/RCIX3LineBloghttp://bodsor.blog.fc2.com/
(2) Sell on rally signal (yellow arrow)
Among the three RCI lines, only RCI9 is rising.
If RCI9 reverses downward, all three lines may turn downward.
In other words, price may fall strongly.
In such a situationBODSOR’s sell-on-rally signal (yellow arrow) lights up.
After the BODSOR signal lights up, following the same line, three consecutive bearish candles occurso, in this case it functions well as a sell-on-rally signal..Indicator displaying Buy on Dip / Sell on Rally signals [BODSOR]Twitterhttps://twitter.com/RCIX3LineBloghttp://bodsor.blog.fc2.com/
so, in this case it functions well as a sell-on-rally signal.
.
Indicator displaying Buy on Dip / Sell on Rally signals [BODSOR]
Twitter
https://twitter.com/RCIX3Line
Blog
http://bodsor.blog.fc2.com/


