

Consider a bullish setup using a combination of 5-minute and 1-minute charts
RCI Three-LineandBODSORusage examples
One of the features of the three-line RCI (RCI9, RCI26, RCI52) is
“When the three RCIs align in the same direction, the price movement in that direction becomes larger.”
There is such a thing.
When RCI26 and RCI52 rise (fall) and RCI9 falls (rises),
if RCI9 reverses“the three RCIs align in the same direction”is what happens.
Therefore, detecting when RCI9 will reverse is very important.
(Case by case, but simply waiting for the reversal of RCI9 to be confirmed often leads to significant delay.)
Hence, to detect as early as possible the timing when the upward (downward) momentum of RCI9 weakens, BODSOR was developed.
The figure below shows USD/JPY 5-minute and 1-minute charts from yesterday (February 19, 2018).
USD/JPY 5-minute
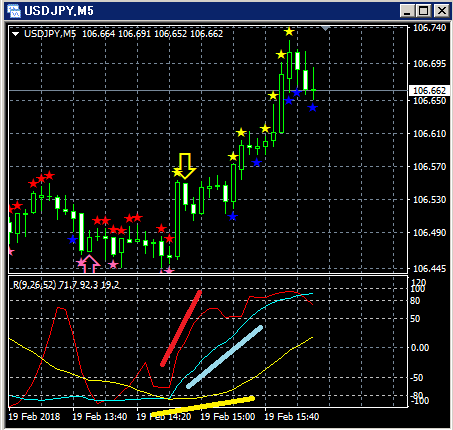
Lower row: three-line RCI (red: RCI9, light blue: RCI26, yellow: RCI52)
The three-line RCI are all rising together, forming a very strong pattern.
Here, looking at the lower 1-minute chart reveals a buying-the-dip opportunity.
This is understood.
USD/JPY 1-minute
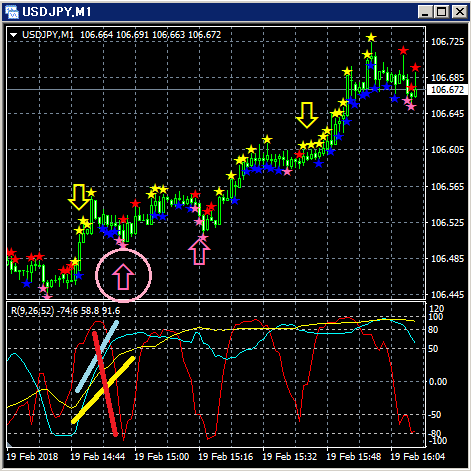
Upper row:BODSOR
Lower row: three-line RCI (red: RCI9, light blue: RCI26, yellow: RCI52)
Among the three lines, only RCI9 is clearly declining.
If RCI9 reverses and rises, all three RCIs may rise together.
In other words, price may rise strongly.
In this kind of situation,BODSOR’s dip-buy signal (pink arrows) lights up.
After the BODSORsignal lights up, prices rise smoothly, so in this case it functions as a dip-buy signal.
Indicator displaying dip-buy and pullback-sell signals【BODSOR】


