

Consider a pullback buy using the combination of the 1-hour and 5-minute charts
Three RCI LinesandBODSORUsage Examples
One of the features of the three RCI lines (RCI9, RCI26, RCI52) is
“When the three RCIs line up in the same direction, the price movement in that direction tends to be larger.”
This is the concept.
If RCI26 and RCI52 are rising (or falling) and RCI9 is falling (or rising),
when RCI9 reverses,“the three RCIs align in the same direction”is attained.
Therefore, it becomes extremely important to anticipate when RCI9 will reverse.
(Case by case, simply waiting for the reversal of RCI9 to be confirmed often leads to a significant delay.)
Hence, to detect as early as possible the timing when the momentum of RCI9’s rise (or fall) weakens
, BODSOR was developed.
The figure below shows today’s (February 19, 2018) USD/JPY 1-hour and 5-minute charts.
USD/JPY 1-Hour Chart
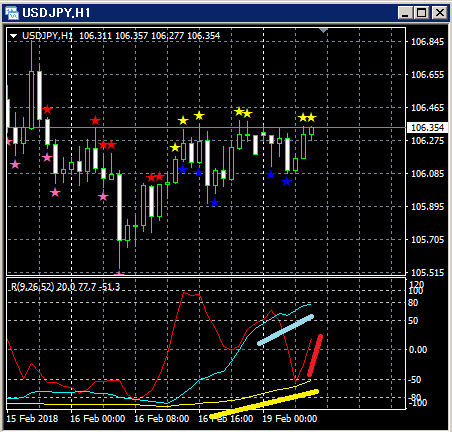
Bottom line: Three RCI lines (red: RCI9, light blue: RCI26, yellow: RCI52)
The three RCI lines are all rising together, forming a very strong setup.
Here, looking at the lower 5-minute chart shows there was a buying opportunity on a pullback.
It is evident.
USD/JPY 5-Minute Chart
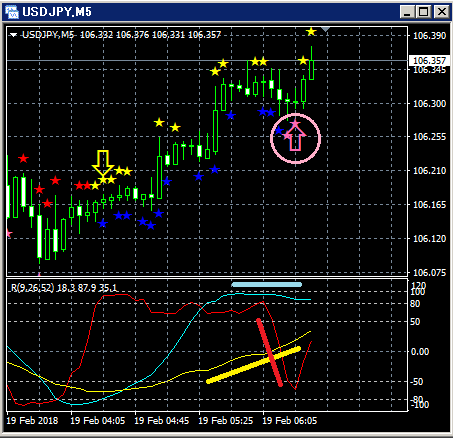
Top: BODSOR
Bottom: Three RCI lines (red: RCI9, light blue: RCI26, yellow: RCI52)
Among the three RCI lines, only RCI9 is clearly declining.
If RCI9 reverses upward, there is a possibility that all three RCI lines rise together.
In other words, price could rise strongly.
In such a situation,BODSOR buy-the-pullback signal lights up.
After the BODSOR signal lights up and price continues to make new highs,
in this case it functions as a pullback buy signal.
(In reality, if you wait for RCI9 to start rising, you may end up late in this case.)
USD/JPY 5-Minute Chart(Subsequent)
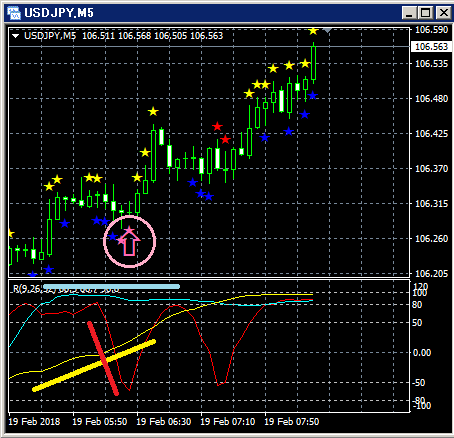
Afterward, as in the above figure, the price rises further.
Indicator that shows pullback buy and/ or return sell signals【BODSOR】


