

The current EURUSD as seen from "RCI3 Three-Line + BODSOR" 20180218
RCI Three-Lite LineandBODSORUsage Example
One of the characteristics of the RCI three-line (RCI9, RCI26, RCI52)
“When all three RCIs point in the same direction, the price movement in that direction tends to be stronger.”
This is the concept.
If RCI26 and RCI52 are rising (or falling) while RCI9 is falling (or rising),
when RCI9 reverses,“All three RCIs align in the same direction”is the implication.
Therefore, detecting when RCI9 will reverse is extremely important.
(Case by case, but simply waiting for a definitive reversal of RCI9 often leads to being late.)
So, to detect as early as possible the moment when the momentum of RCI9's rise (fall) weakens,
BODSOR was developed.
Regarding EUR/USD, start with the weekly chart.
EUR/USD Weekly
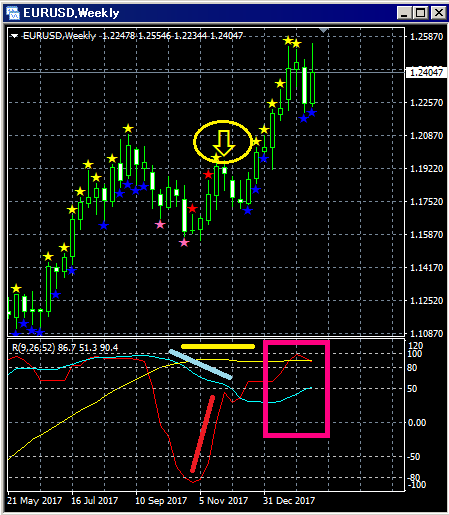
Top panel:BODSOR
Bottom panel: RCI three-line (red: RCI9, light blue: RCI26, yellow: RCI52)
At the end of November last year, only RCI9 showed an upward pattern, and a return-sell signal of BODSOR (yellow arrow) illuminated.
At that time, after the signal illuminated, the three RCIs began to move downward together, three consecutive bearish candles appeared, but the decline did not continue.
Currently, as indicated by the pink box, if RCI9 truly turns downward, there will be at least a temporary move downward on the weekly level.
So, we will look at the next lower time frame.
EUR/USD Daily
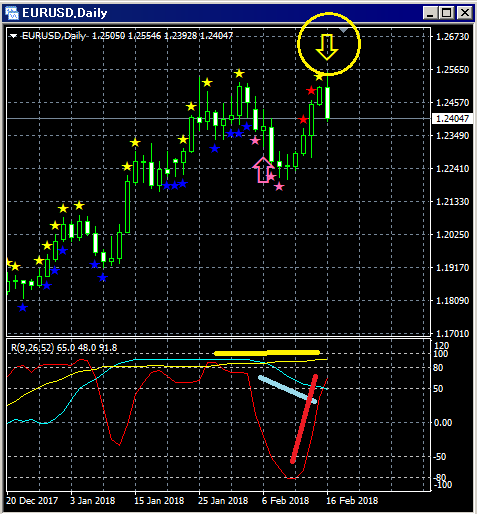
Top panel:BODSOR
Bottom panel: RCI three-line (red: RCI9, light blue: RCI26, yellow: RCI52)
Among the three RCI lines, only RCI9 is clearly rising.
If RCI9 reverses downward, all three RCIs could align to decline.
In other words, prices could fall sharply.
In such a scenario,BODSORreturn-sell signal (yellow arrow) lights up.
Right after the signal lit up (last Friday), a solid bearish candle formed.
We are watching whether the RCIs will align to drop on the daily chart smoothly and whether the price will fall strongly.
Indicator displaying Buy on Dips / Sell on Rallies【BODSOR】


