

Example of buy entry signal for "RCI3 本ライン+BODSOR" EURUSD 4-hour chart 2018/02/15
RCI 3-LineandBODSORusage examples
One of the features of the three-line RCI (RCI9, RCI26, RCI52) is
“When all three RCIs are aligned in the same direction, the price movement in that direction tends to be larger.”
There is such a thing.
When RCI26 and RCI52 are rising (falling) and RCI9 is falling (rising),
if RCI9 reverses,“All three RCIs align in the same direction”becomes a possibility.
Therefore, it becomes extremely important to sense when RCI9 will reverse.
(Case by case, but simply waiting for a confirmed reversal of RCI9 often leads to a significant delay.)
Therefore, to detect as early as possible the timing when the momentum of RCI9’s rise (fall) weakens, BODSOR was developed.
The diagram below is an example of the EUR/USD 4-hour chart.
EUR/USD 4-hour chart
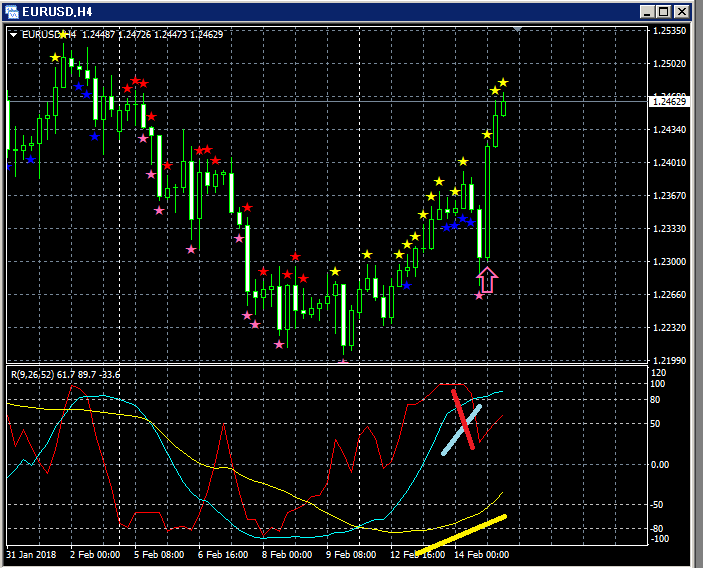
Top row:BODSOR
Bottom row: RCI 3 lines (red: RCI9, light blue: RCI26, yellow: RCI52)
Among the three RCI lines, only RCI9 is clearly declining.
If RCI9 reverses upward, all three RCIs may rise together.
In other words, prices may rise strongly.
In such a situationBODSOR’s pullback buying signal (pink arrow) lights up.
BODSORAfter the signal lights up, three consecutive bullish candles appear and push prices higher,
so in this case the pullback buying signal functions well.
(In practice, waiting for RCI9 to turn upwards would cause a noticeable delay, resulting in a large bullish candle being missed.)
Indicator that shows pullback buying and retracement selling signals【BODSOR】


