

Consider pullback buying using a combination of daily and 4-hour charts
RCI 3-LineandBODSORUsage examples
One of the features of the RCI 3-Line (RCI9, RCI26, RCI52) is
“If the three RCIs line up in the same direction, price movement in that direction becomes larger.”
There is such a thing.
When RCI26 and RCI52 are rising (falling) and RCI9 is falling (rising),
if RCI9 reverses,“all three RCIs line up in the same direction”will occur.
Therefore, detecting when RCI9 will reverse becomes very important.
(Case by case, but simply waiting for a confirmed reversal of RCI9 often leads to being late.)
To detect as early as possible the timing when the rising (falling) momentum of RCI9 weakens,
BODSOR was developed.
The figure below is an example of a daily chart and a 4-hour chart of USD/JPY.
USD/JPY Daily
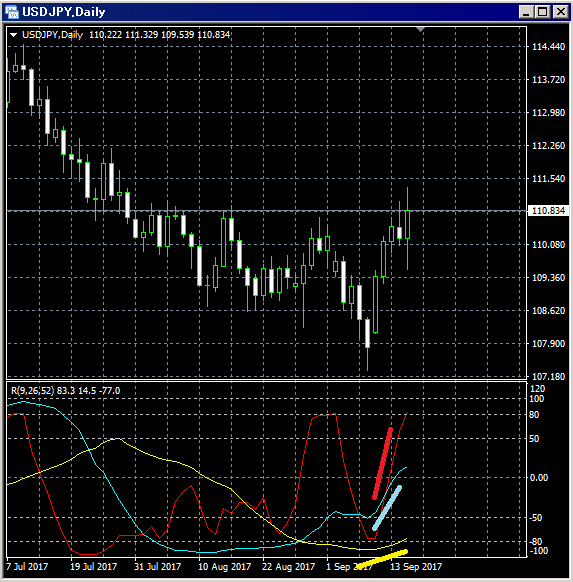
Lower: RCI 3-lines (red: RCI9, light blue: RCI26, yellow: RCI52)
RCI 3-lines are all rising together, forming a very strong pattern.
Here, looking at the lower 4-hour chart reveals a pullback buying opportunity
that was evident.
USD/JPY 4-Hour
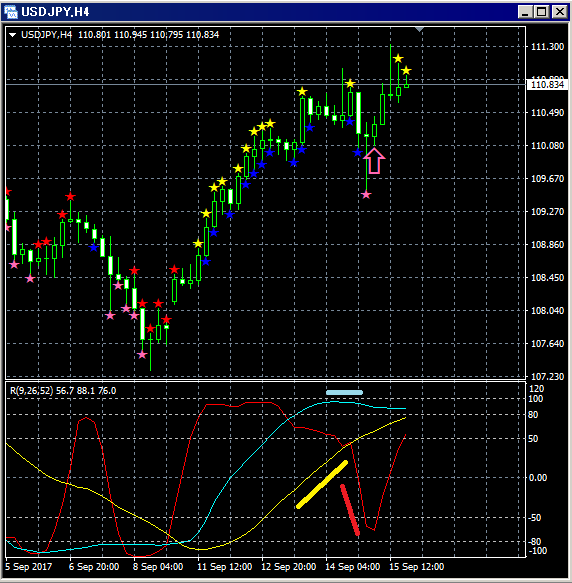
Upper:BODSOR
Lower: RCI 3-lines (red: RCI9, light blue: RCI26, yellow: RCI52)
Among the three lines, only RCI9 is clearly declining.
If RCI9 reverses and rises, all three lines may rise together.
That is, price could also rise strongly.
In such a situation,BODSORpullback buy signal lights up.
After the signal lights up, two bullish candles follow and the price rises even more,
so in this case the pullback buy signal functions well.
(In reality, waiting for RCI9 to turn upward would cause a noticeable delay of two bullish candles in this case.)
IndiShow signal for pullback buy / retracement sell【BODSOR】


