
[Members Only] Correlation and Anticorrelation Series! When Cross Yen synchronizes, it becomes the strongest trend!
Dear members, I would like to thank you as always for this month as well.
This month, we are planning an upgrade of five beginner-friendly trading rules.
As introduced in the previous blog, we are currently planning an upgrade of the indicator "Ajinichi".
We also intend to advance the development of the "Ajinichi Fully Automated Trading EA".
I will inform you of the progress here in this article once again to show how far we have progressed within this month.
Now, to the main topic.
First, please watch this [Member-Only Public Video].
The above URL is videos exclusively available to paid article subscribers and to purchasers of "Ajinichi"; please refrain from spreading the link on SNS or elsewhere.
Now, I will use still images to explain correlation and reverse correlation.
The five beginner-friendly trading rules are certainly effective for intermediate traders as well, but if you can make instantaneous discretionary judgments in addition, by discerning the accuracy of signals and determining the advantage of signals through correlation and reverse correlation, you will be able to enter trends without waiting for a dip or retracement, which is the greatest strength.
Also, even if you are not using "Ajinichi," continuing to read this article may help you establish methods using Ichimoku or high/low prices.
Since we have the opportunity, let's look at the current correlations and reverse correlations among 12 currency pairs.
Before that, the reason the 12 currency pairs are displayed is because I have a personal interest in the Nikkei 225 and gold; the correlations and reverse correlations with those two and the other ten currency pairs are not certain.
Compared to the dollar-yen, gold seems to have some relation, but there isn't solid evidence, so please understand that I do not base entries on correlations between the Nikkei 225 and gold.
However, the signals appear similarly for the Nikkei 225 and gold, so traders should verify with the signals and chart patterns.
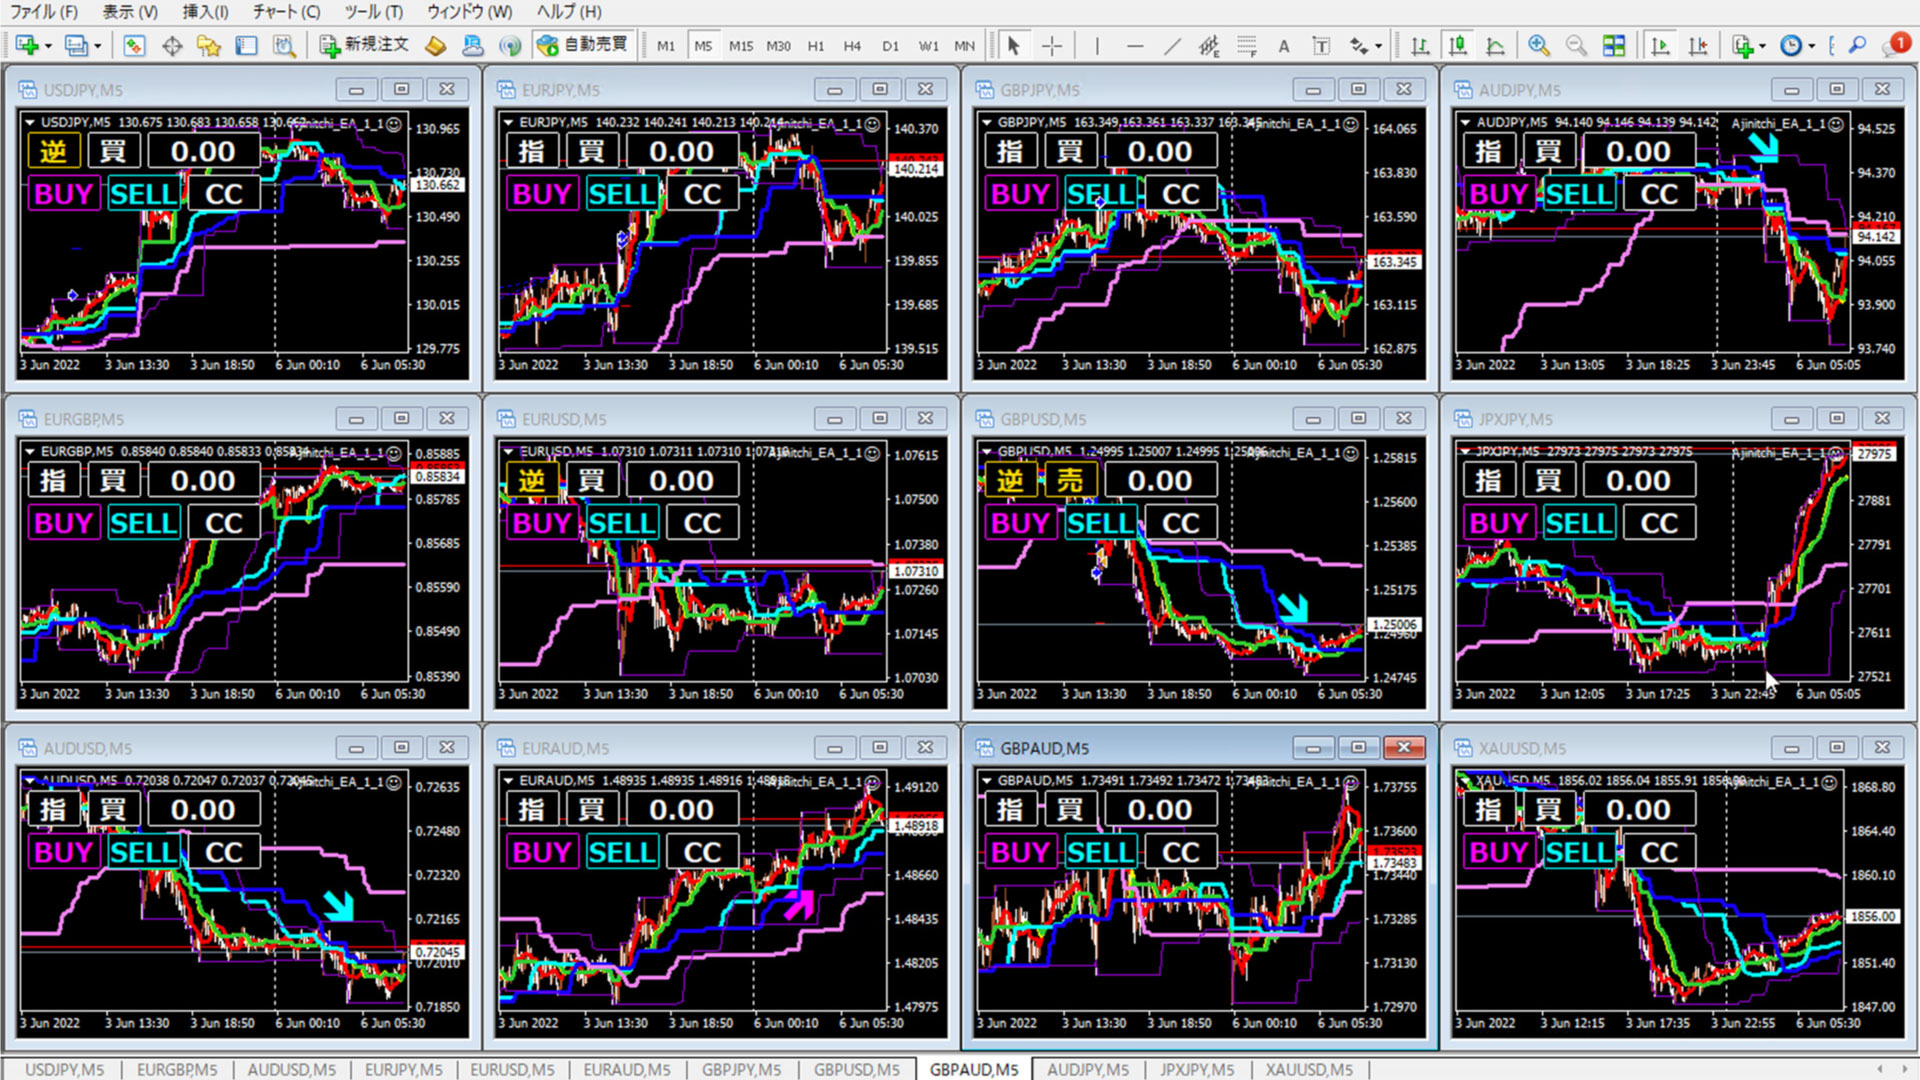
This is the VPS screen I captured earlier.
Even when there is no signal, or when a signal arrives on your smartphone, what do you look at first?
Of course, the signal, right?
During verification, which signal appears first in the morning?
And which signal appeared most recently?
Next, check the relationship between the long-term baseline and the remaining five PO lines and the price level.
From this, I think the first signal is AUDJPY or EURAUD.
Which direction is today’s daily candle heading?
Is it bearish?
Is it bullish?
Observe the relation between yesterday’s high/low and today’s high/low.
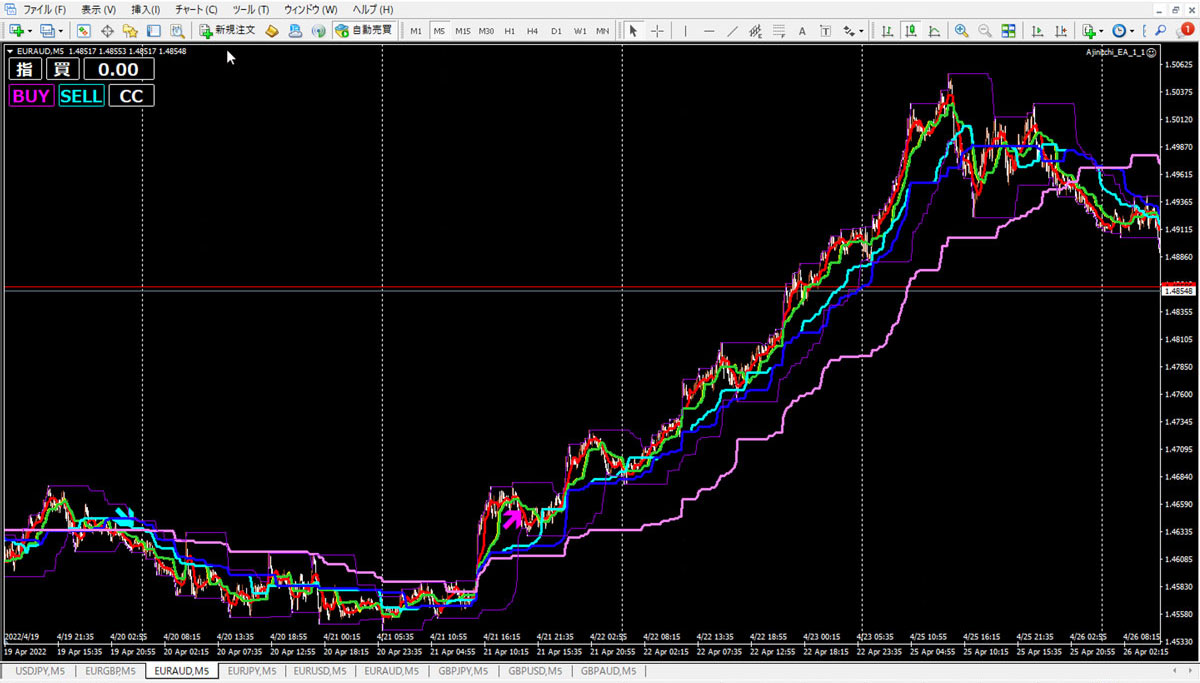
To view the weekly trend, a magnified image is optimal, so I will magnify AUD/JPY, which is believed to have produced the signal first in the morning.
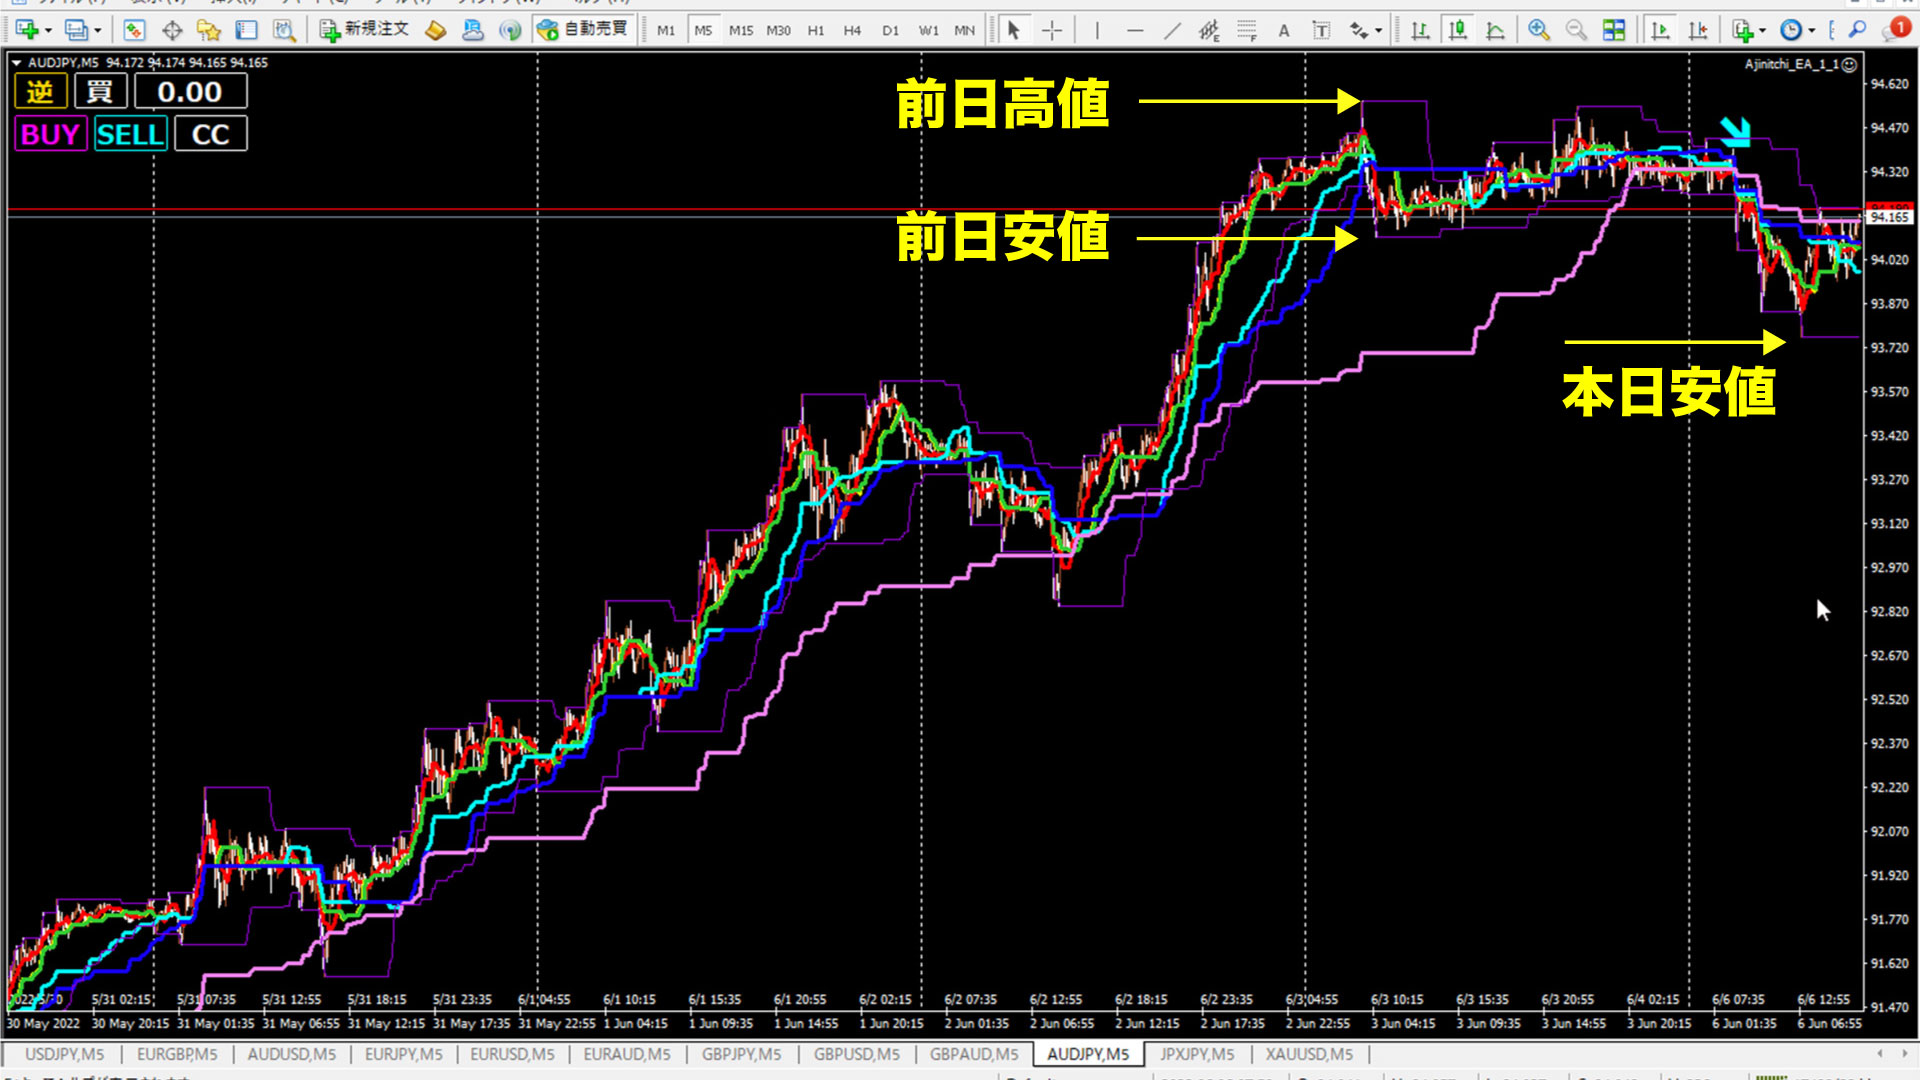
Looking at the chart above, how do you see this past week?
Today is Monday, so before the date line, it is last week’s chart.
Last week, AUDJPY had a large bullish candle on the weekly chart.
And today, regarding the previous day’s high and low?
It did not break the previous day’s high and broke below the previous day’s low.
It might be a top forming.
What about other currency pairs at the same time as this short signal?
First, the correlation pairs: AUDUSD, EURAUD, GBPAUD, and then generally all cross currencies.
First, is the AUD weak against the other pairs?
Is it the weakest currency?
We will look at these in order.
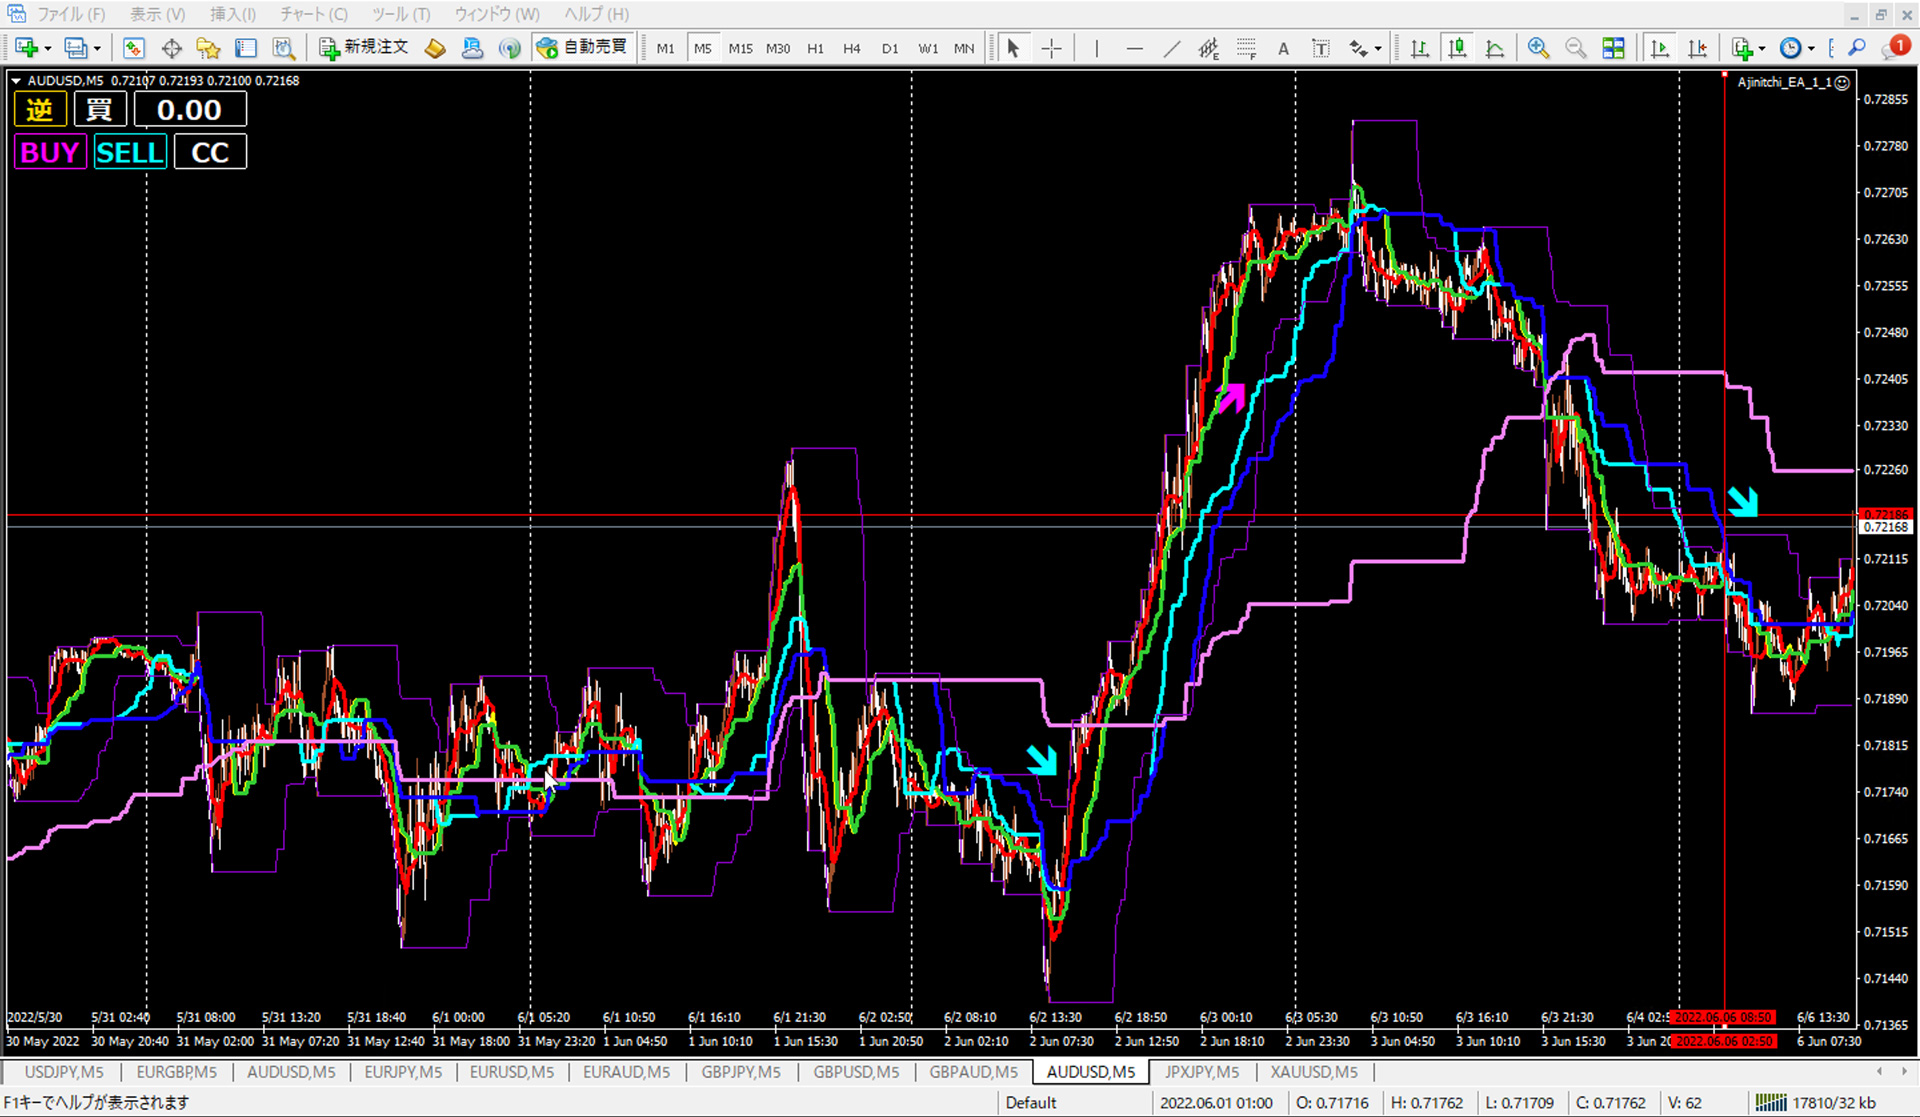
AUDUSD, at the time of the red vertical line, did not yet show a signal, but the PO completed nicely and the price updated today’s intraday low.
In other words, today’s daily candle could extend downward.
From last week’s price action, AUDJPY showed a strong bullish candle and that AUD was strong against the yen.
Against the dollar, last week there was not a clear downtrend, but a range, and the price rose sharply toward the end of the week, so I judge that the dollar was not particularly weak either.
Therefore, the current AUD decline is suitable for scalping.
The question is whether to enter with a small profit-target strategy.
Next, what about the euro?
EURAUD is here.
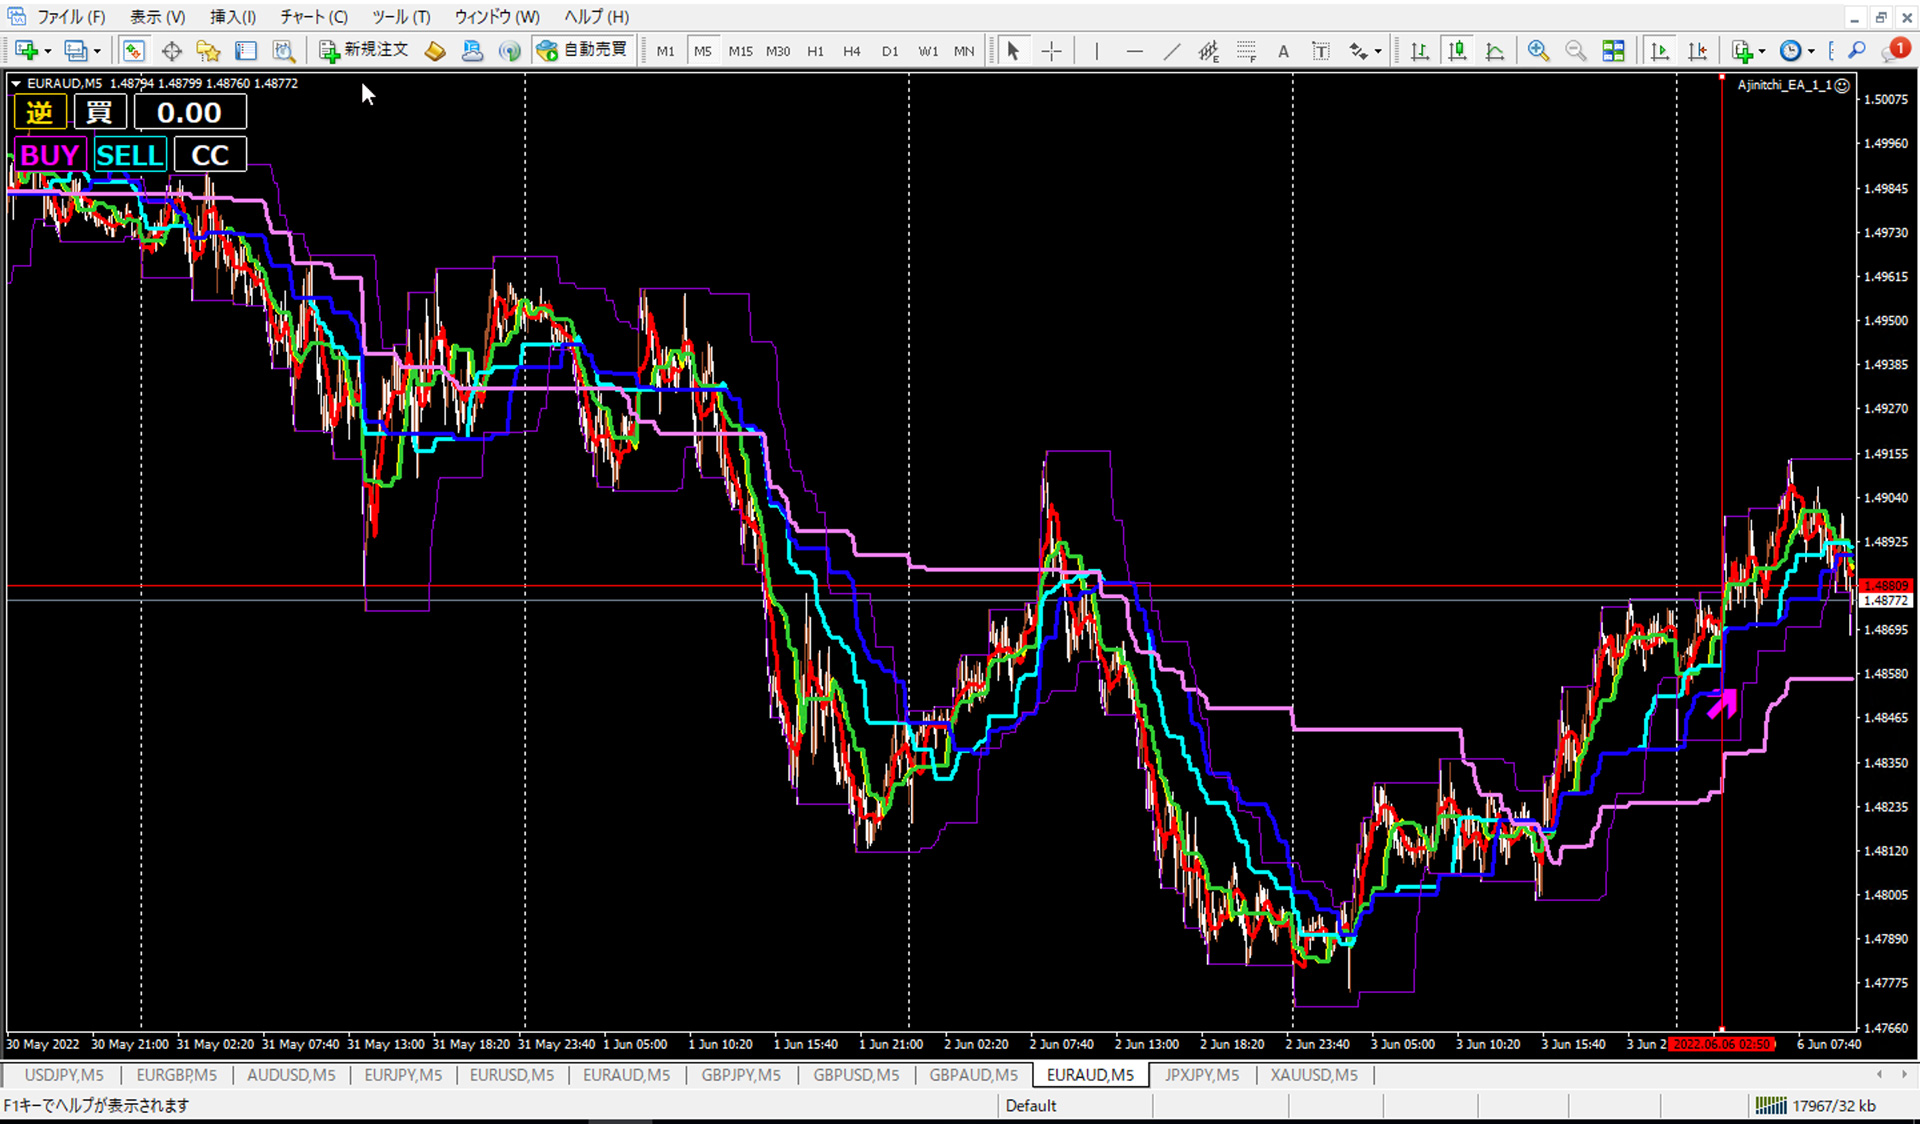
Wow!
Almost simultaneously, EURAUD showed a long signal, and it entered a rebound phase from the previous day, with a long lower wick on the weekly chart last week.
That means today’s daily candle may extend bullishly in the short term.
However, since last week’s candle had a lower wick, we still consider it weak.
Long positions are only realistic for scalping or similar strategies.
However, since we have enough corroboration from correlation and reverse correlation up to this point, we will look at GBPAUD and enter on the market price.
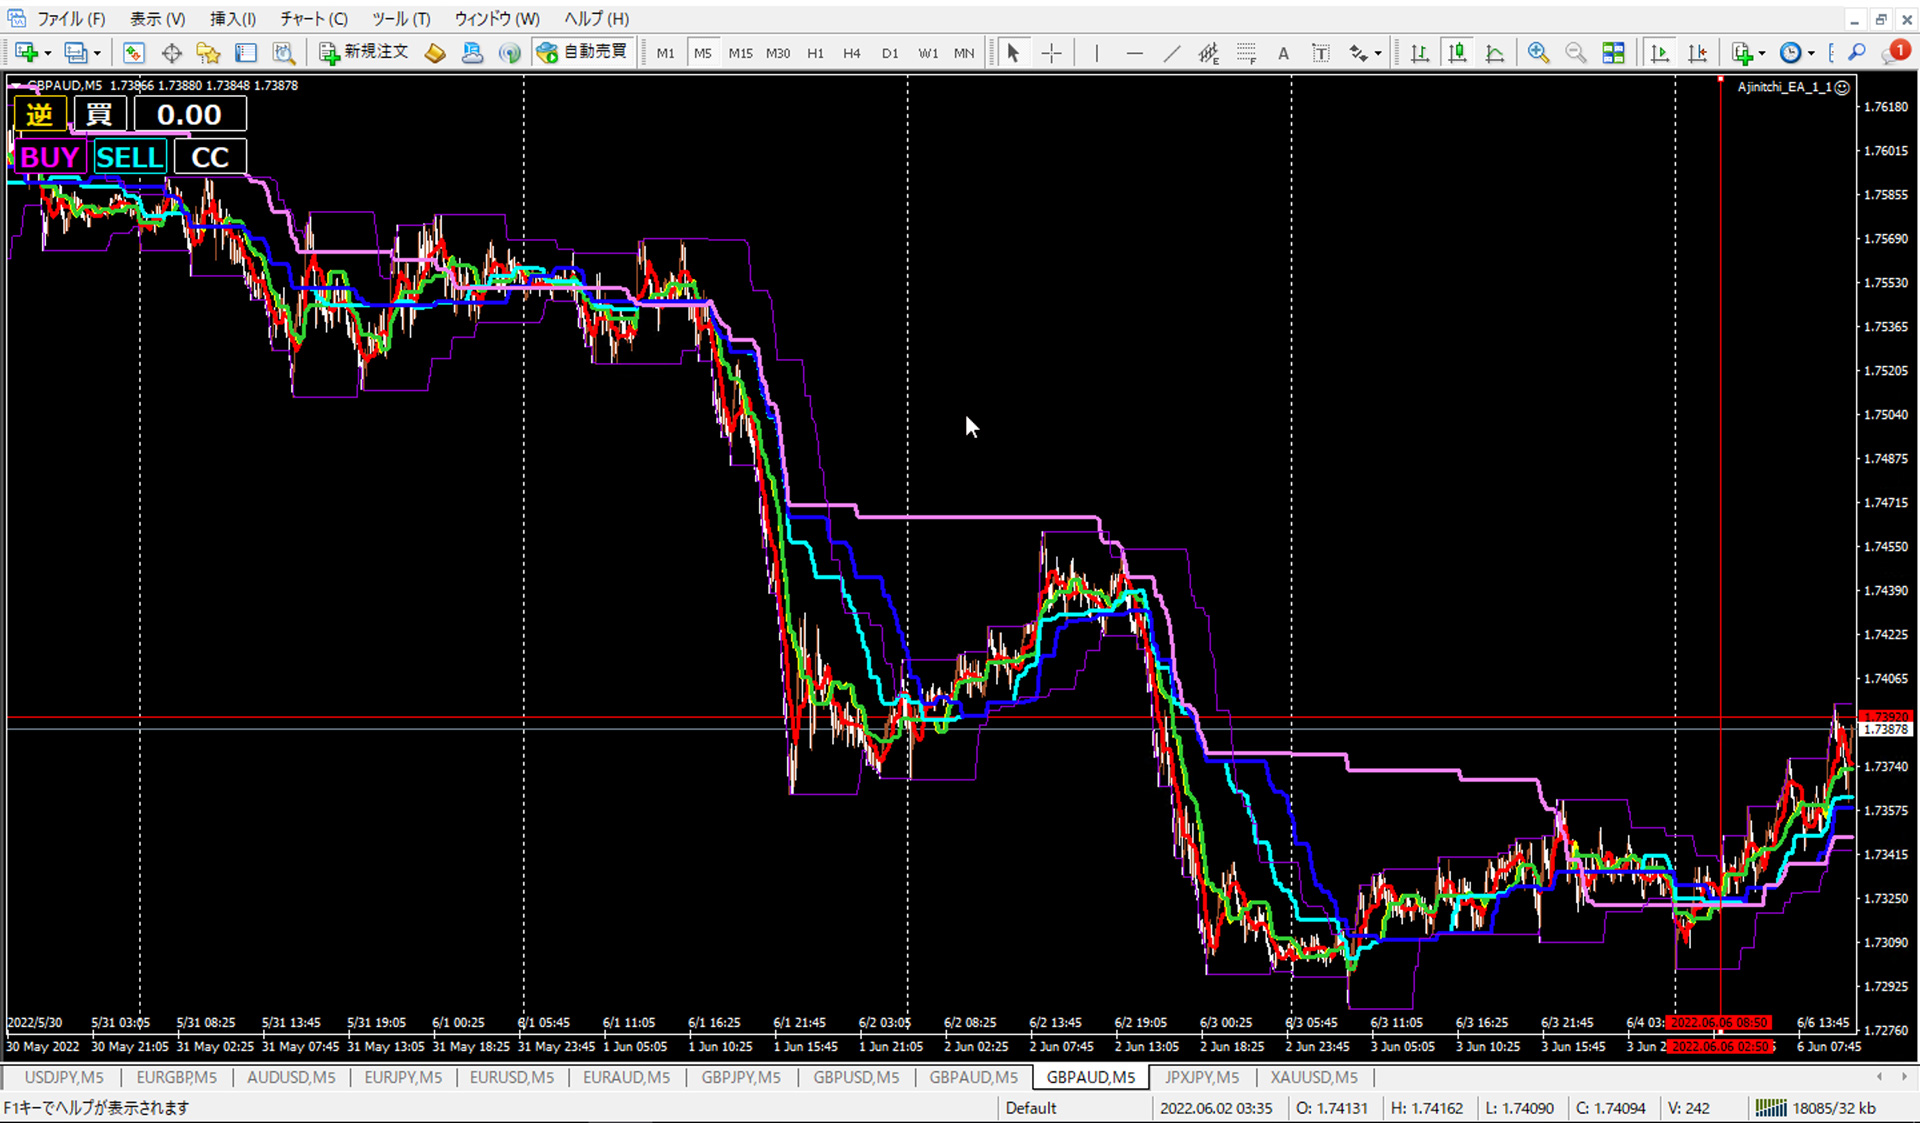
There is perfect correlation.
EURAUD and GBPAUD are rising from a downtrend, i.e., they are rebounding.
It is not yet a major trend, but I determine that small-profit targets in the near term for long positions are fine.
Finally, let us also look at EURJPY (Euro/Yen cross).
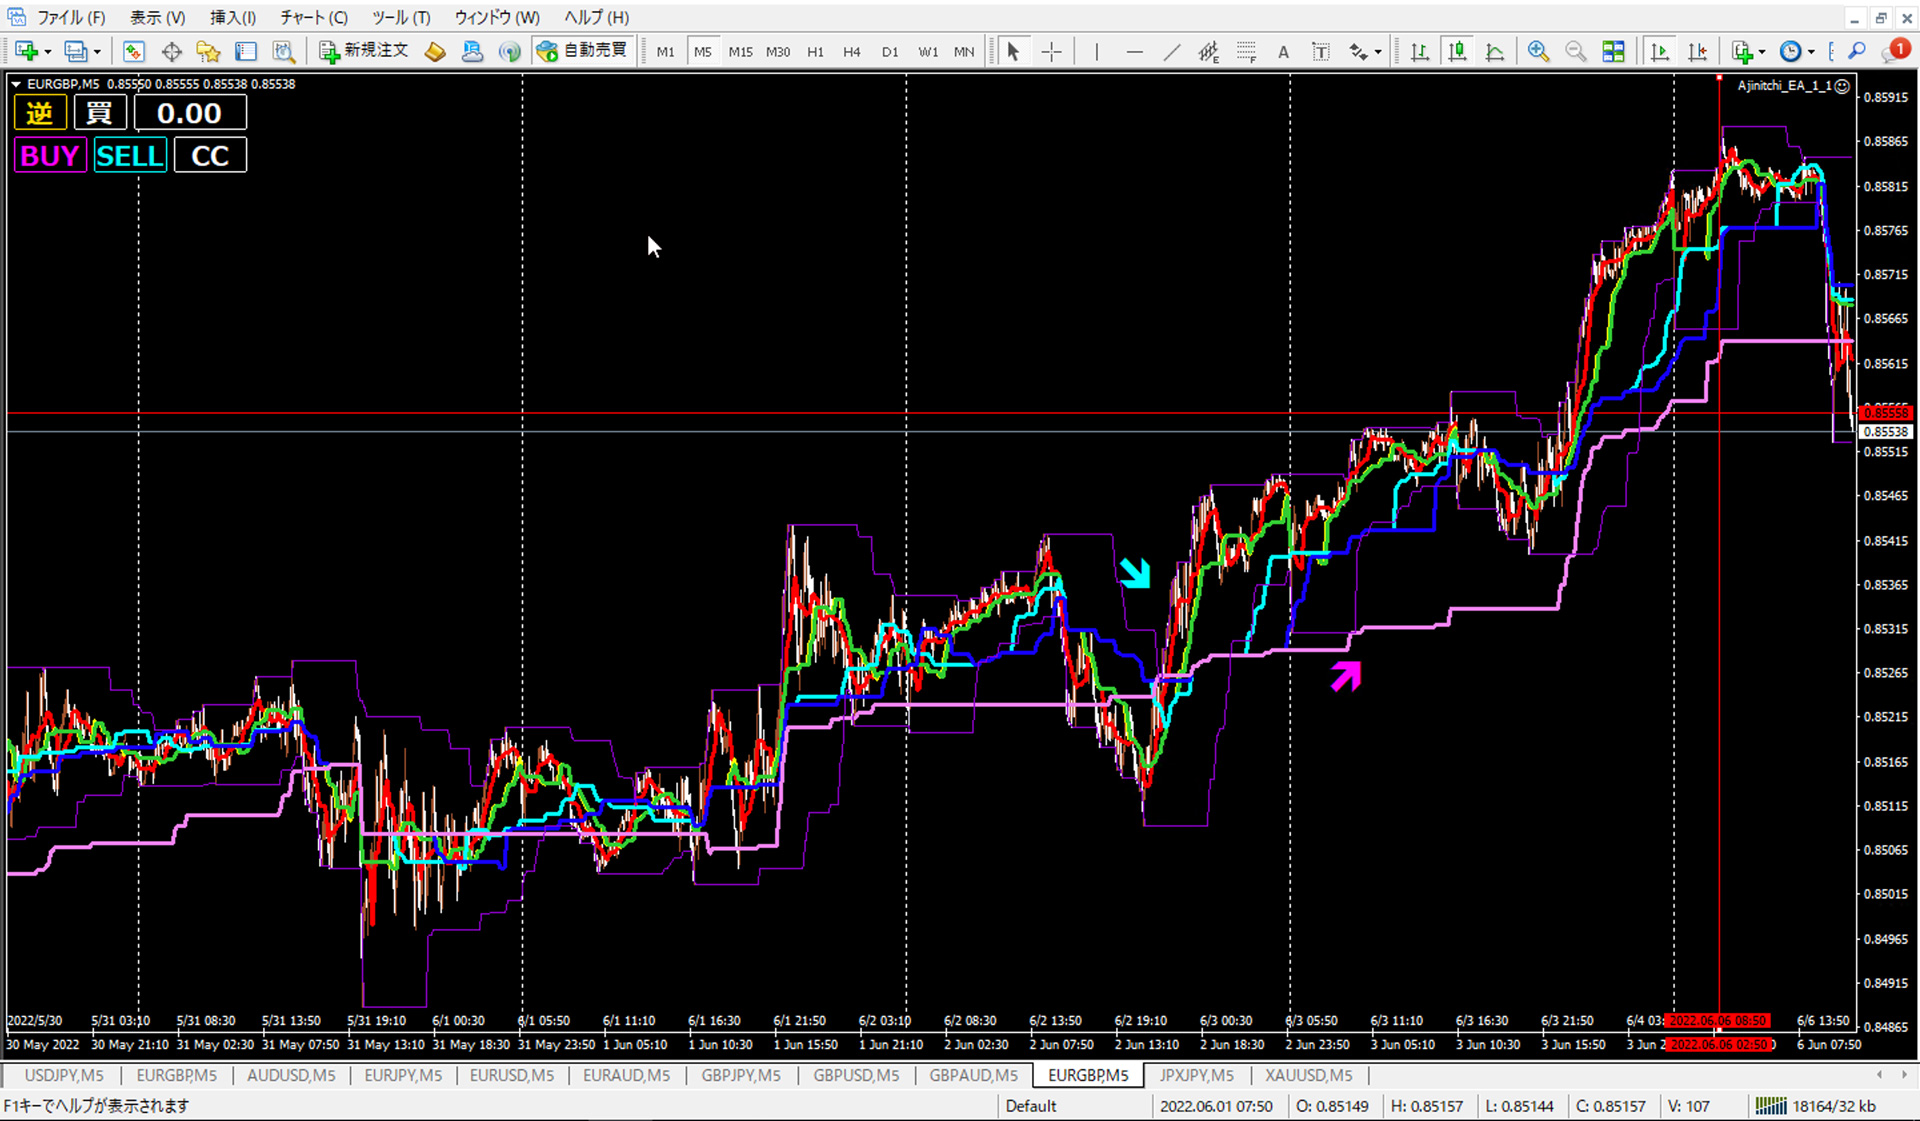
In EURJPY, the rightmost red vertical line shows the euro was strong, but AUDJPY, AUDUSD, EURAUD, and GBPAUD all align in correlation and reverse correlation, so I would assume all four pairs entered near-simultaneously with the signal.
If you narrow it down, EURJPY is rising, so EURAUD alone would also be acceptable.
Depending on cross-yen strength, AUDJPY could also be good, but cross-yen has been yen-depreciating for several months, so you probably don’t want to sell foreign currencies, right?
Therefore, if trading single pairs, use EURAUD; if trading multiple pairs, place market-entry orders on the four pairs above simultaneously.
Hypothetically, if we follow this test and observe the morning short signal AUDJPY first thing and quickly judge 10 currency pairs and take positions within five minutes, then...
AUDJPY short = up to +48 pips of the lowest price
AUDUSD short = up to +15 pips of the lowest price
EURAUD long = up to +35 pips of the highest price
GBPAUD long = up to +58 pips of the highest price
A total potential of 156 pips in unrealized profits, and today this trend may continue, though market conditions are unclear and could reverse back toward the larger weekly trend.
Thus, at the weekly level, the situation is not something to be sure about, so it is important to take small profits and small stop losses.
This has become quite lengthy, but today I will stop here.
Cross-yen will be left as homework for the next time.
At this point, how do you view the four cross-yen pairs?
What do you do?
What do you not do?
Please think about it.
See you again!
This was Sora, a part-time trader.
Investment Navi+ (first half is free articles; second half is for subscribers)
https://www.gogojungle.co.jp/finance/navi/series/1543
For purchasers of the paid indicator "Ajinichi", the Ultra-secret technique is here. [Password required]
https://www.gogojungle.co.jp/finance/navi/series/1565
MT4 Indicator "Ajinichi" sales site
https://www.gogojungle.co.jp/tools/indicators/36476
Discretionary trader’s strongest supplemental tool "Ajinichi EA" sales site