
Correlation and inverse correlation for members
Good evening to all members.
I am Sora, a part-time trader.
Today, the first half explains spreads, and the second half discusses "correlation and inverse correlation".
I hope this can be of help in your trading life.
First, please watch the method explanation video for members.
Today as well, I will explain correlation and inverse correlation.
By mastering this technique, you can actually reach a realm that is often referred to as the Holy Grail.
In fact, I maintain a 100% win rate.
Of course this isn’t to say there are no stop losses, but when the total of three positions ends in a net profit, even if two of those positions incur stop losses, one position can cover two losses, and if the total profit and loss from the three positions is more than 10 pips, it is counted as one trade when viewed as a trade, even though it consists of three positions.
In other words, regardless of how many positions there are, the earnings are calculated per one trade, so if each one trade ends with a positive result, I consider it as one win or more.
In that sense, I have continued to maintain a 100% win rate.
Now, let’s get to the main topic.
Please look at the list of correlations and inverse correlations.
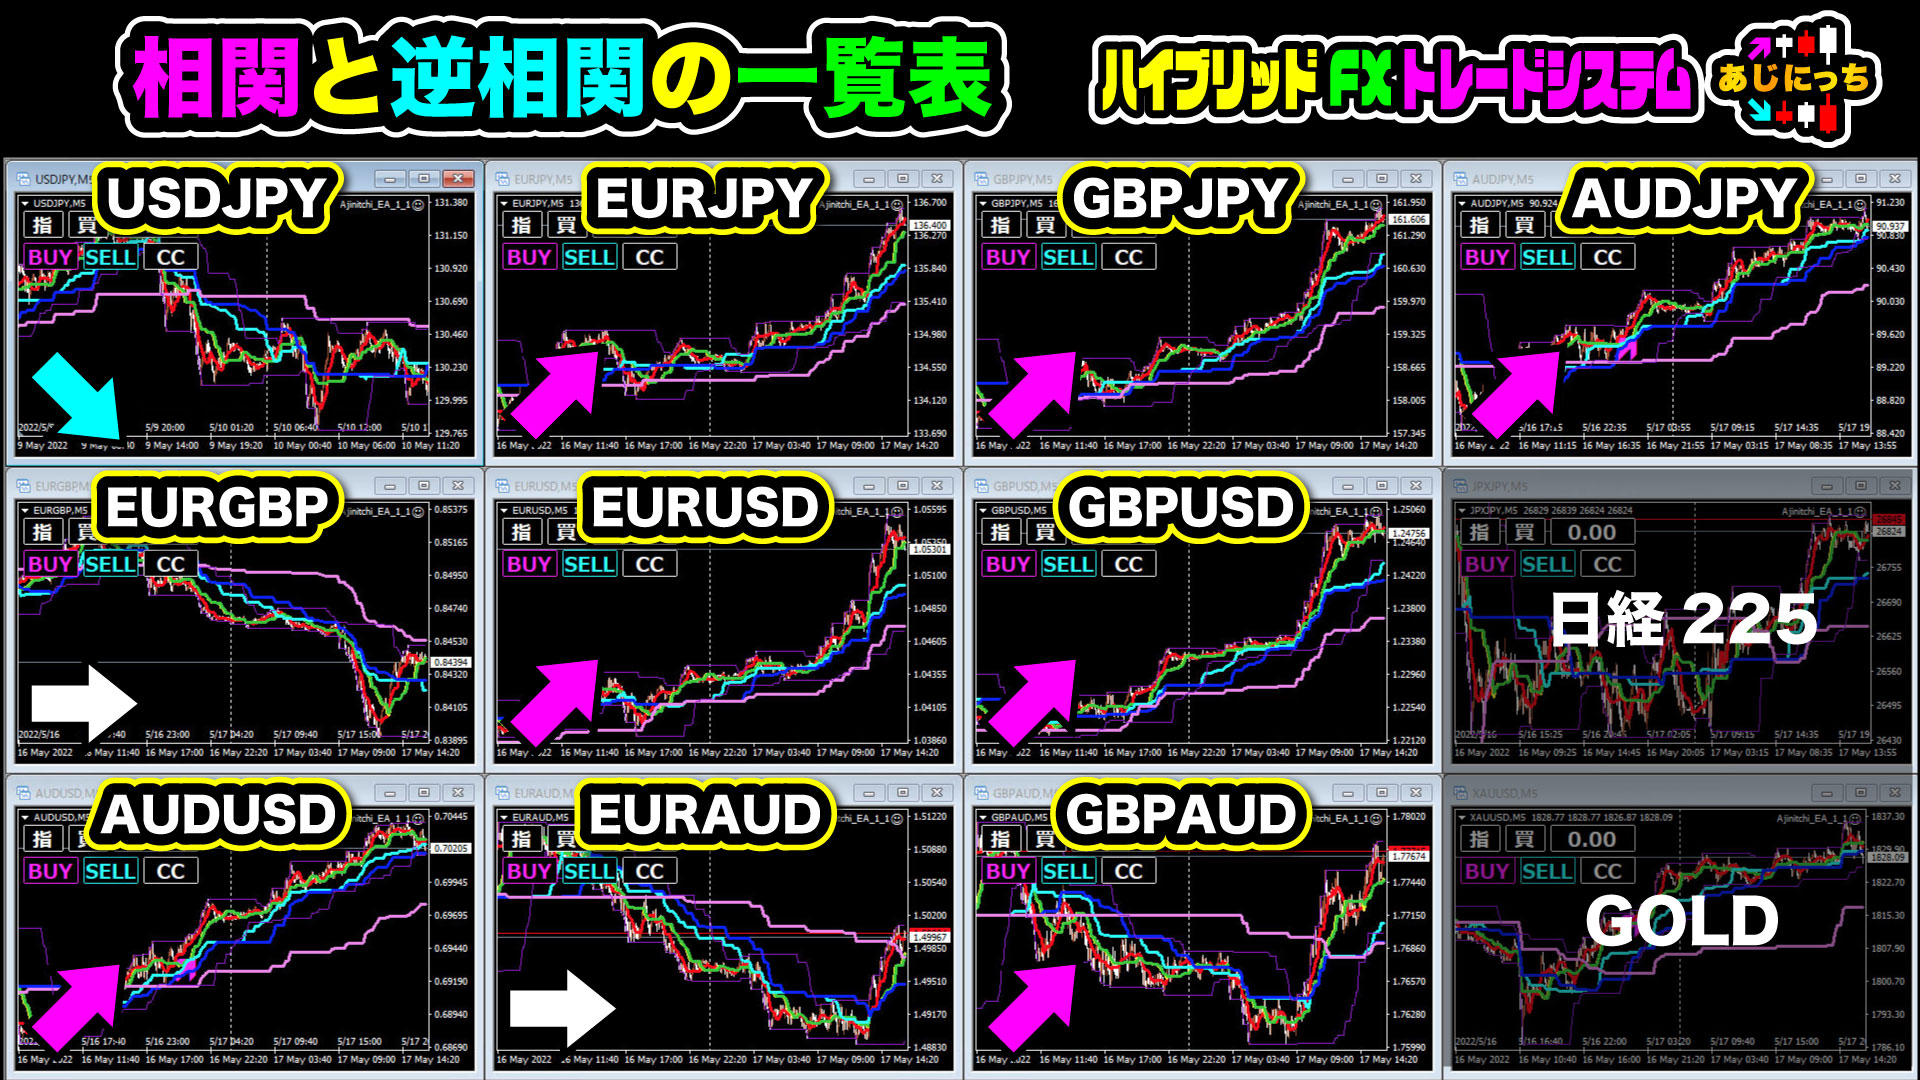
These are the 12 currency pairs at the current moment.
As of now, it is May 17, 2022 (Tuesday) 11:00 PM.
In this way, ten currency pairs are divided into three market conditions.
① Uptrend
② Downtrend
③ Ranging market
The arrows in the image indicate these.
The first step in correlation and inverse correlation is to analyze the market direction.
What defines an uptrend?
What defines a downtrend?
What defines a ranging market?
If you don’t have this common understanding, the terms I explain will start to diverge.
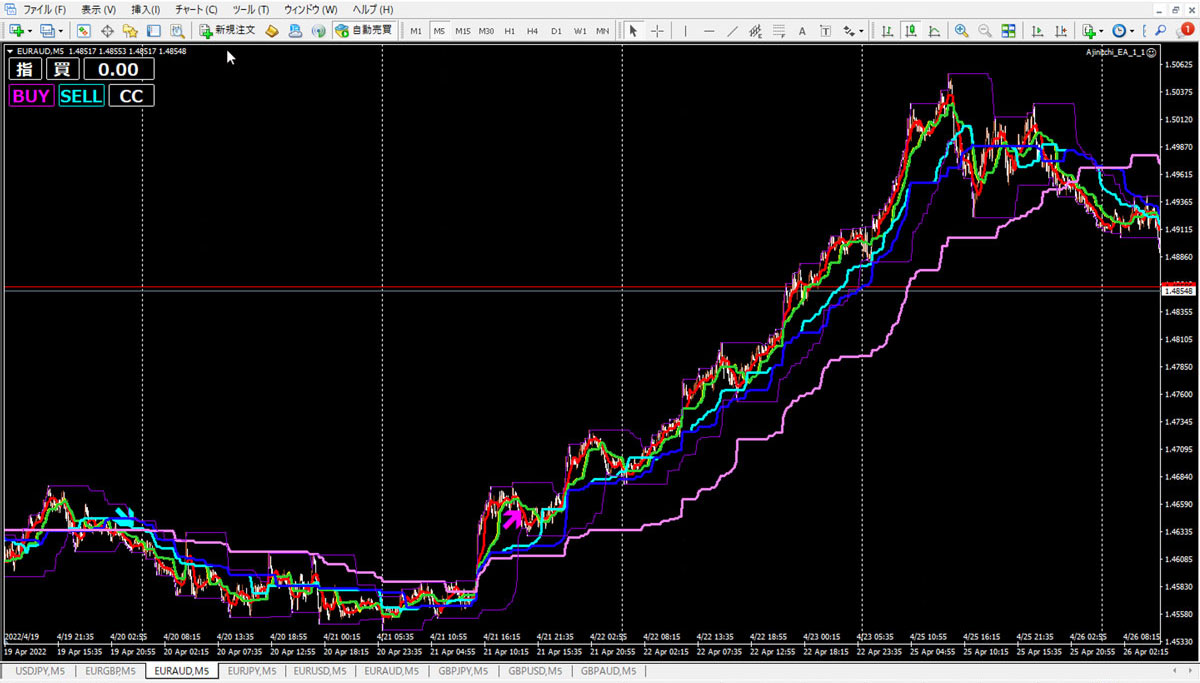
In the figure above, USD/JPY is in a downtrend, while EUR/JPY, GBP/JPY, and AUD/JPY are in uptrends.
In this case, the definition of uptrend, as I have told you many times, is the price crossing above the six turning lines and the baseline PO.
And when the price is at the top in the PO state, we call it an uptrend.
In other words, a state where today’s high can be updated is expected.
Therefore, we judge the continuation of the upper layer trend by a breakout of the recent high.
That is why we place a long stop order around 2 pips above the most recent high.
Downtrends are the opposite, so I will omit that here.
And then the ranging market.
Two ranging marks on EUR/GBP and EUR/AUD have horizontal arrows.
So what defines a ranging market?
It is because it moves away from today’s new high or new low in the opposite direction.
To be concrete, why did EUR/CHF determine a ranging market?
It has fallen sharply, the new low was reached and then paused, and a rebound occurred.
That rebound has returned to the long-term baseline and hit a high; will it break above the long-term baseline and turn the trend?
Or is this the point where the next major drop becomes unclear?
Please also look at EUR/JPY here for this explanation.
Similarly, in a rebound phase from a downtrend, the price has moved back to the long-term baseline, but it becomes unclear whether it will reverse or continue a new downtrend.
In other words, anything difficult to judge can be treated as ranging.
The long-term baseline is a line corresponding to half of the 4-hour chart, so it serves as a gauge for price adjustments like half retracements or half pushes.
From this viewpoint, the currency pairs with uptrend or downtrend marks are in positions where today’s high and low can be captured more easily.
When you judge correlation and inverse correlation yourself, you need to discern these three kinds of market perspectives first.
Writing them down on paper makes it easier to understand, so please try it.
What does it mean to update today’s highest price or lowest price?
Yes, it means you are assuming which direction the daily candle will tend to grow.
In Dow Theory, if you surpass the previous day’s high and today’s highest price continues to be updated, you judge that the uptrend continues.
Thus, how will today’s daily candlestick move?
Please imagine the EUR/JPY daily chart that was judged as a ranging market.
A candlestick that extended downward has a long lower shadow, and the lower shadow keeps growing.
The longer this lower shadow, the farther away the new low is, right? The same goes for the upside.
If prices keep falling from the highest price, would you enter a long when the daily candle’s upper wick grows too long and the highest price seems unlikely to be reached?
Now a question.
Among the ten currency pairs in the diagram above, which one is the strongest?
Conversely, which one is the weakest among the ten?
Please derive this by combining the arrows noted.
A hint is in the vertical columns.
The currency pair with the same trend in the vertical column is the strongest.
And the weakest is evident when viewed in the horizontal row.
I will write the answer in the next article.
See you again!