Indicator aiming to align the direction of the three main lines (1)【R1R2S3】
RCIis an indicator that fluctuates between -100 and +100; when it reaches the overbought zone (for example above +80) it may be deemed overbought, and when it reaches the oversold zone (for example below -80) it may be deemed oversold.
On the other hand, RCI can also cling to the overbought or oversold zone, and in that case it may be interpreted as indicating that a strong uptrend (downtrend) is continuing.
Additionally, the direction pointed to by the RCI may be interpreted as the direction of price movement.
It is common to use a combination of three RCIs, typically using RCI9 for short-term, RCI26 for mid-term, and RCI52 for long-term. This triple RCI combination is sometimes called the three-line RCI combination.three-line RCI
When the directions of all three RCI lines align, there can be an acceleration of price movement in that direction, making it an important chart point to watch.
Indicator to Time the Alignment of the RCI Three-Line DirectionThere are several types, and here we introduce one of them called 【R1R2S3】.
https://www.gogojungle.co.jp/tools/indicators/24609
This indicator determines the entry direction by focusing on the direction of two mid- to long-term RCIs (for example, RCI26 and RCI52) and uses a short-term RCI (for example, RCI9) for entry timing.
The most notable feature is that it usesthe "Three-Stage Judgment"to determine overbought and oversold levels.
Have you ever set the RCI overbought line (oversold line) to, say, +80 (-80), and planned to sell (buy) when RCI reaches and reverses from that line, only to see it reverse before reaching +80 (-80) and miss the opportunity?
To avoid such situations, this indicator uses the “Three-Stage Judgment” for the overbought/oversold determination of the short-term RCI.
Settings
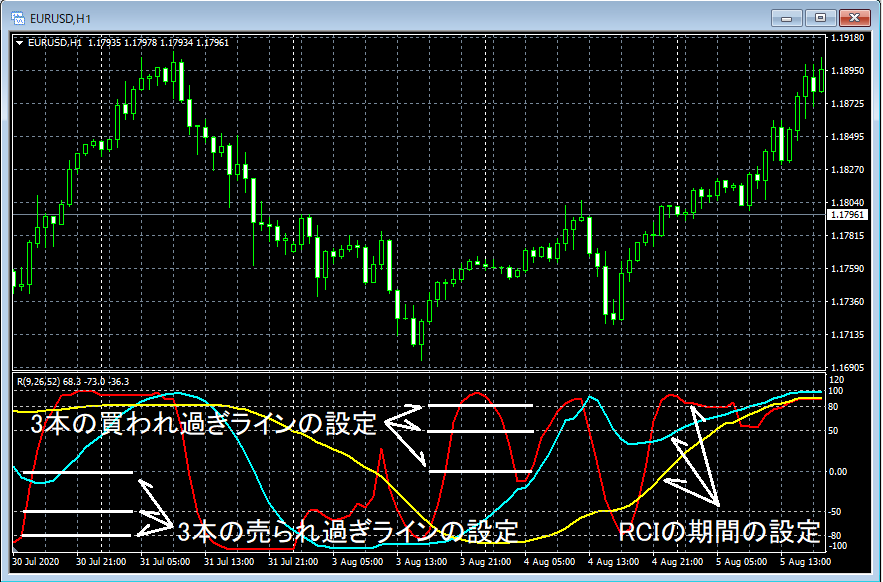
Signs
※ The indicator displaying RCI is not included in the 【R1R2S3】 package, please note.
In the diagram below, RCI is displayed for convenience, but in reality, even if you install 【R1R2S3】, RCI will not be displayed.
Even if you already have RCI displayed with your preferred settings, installing 【R1R2S3】 will not cause RCI to suddenly display again.
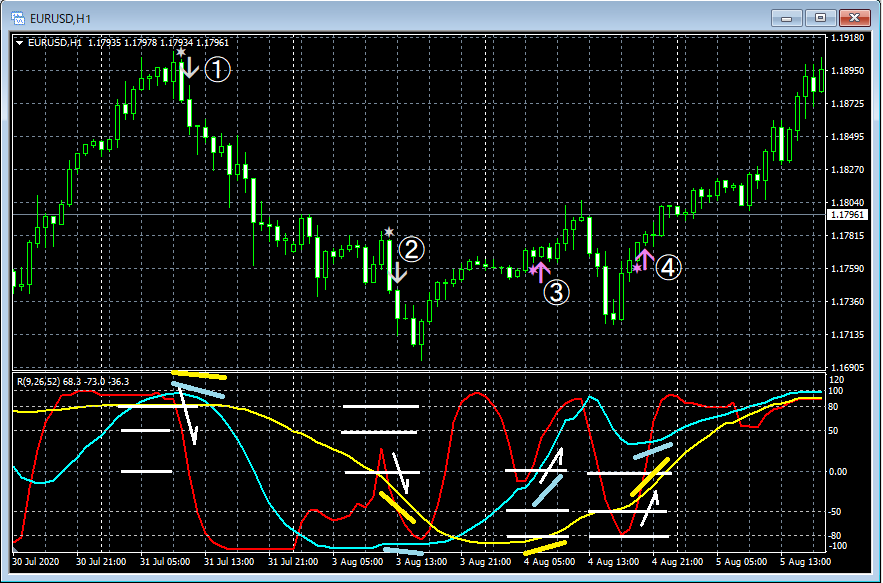
First sign
Because the short-term RCI has reached the third overbought line, when the short-term RCI breaks below the third overbought line and both mid- and long-term RCIs are turning downward, a sell signal appears. (Afterward, when the short-term RCI breaks above the first or second overbought line, no sell signal is generated.)
Second sign
Because the short-term RCI has only reached the first overbought line (not the second or third), once the short-term RCI breaks below the first overbought line, and both mid- and long-term RCIs are turning downward, a sell signal is generated.
Third sign
Because the short-term RCI has only reached the first oversold line (not the second or third), when the short-term RCI rises above the first oversold line while mid- and long-term RCIs are both turning upward, a buy signal is generated.
Fourth sign
Because the short-term RCI has only reached the second oversold line (not the third), when the short-term RCI rises above the second oversold line and both mid- and long-term RCIs are turning upward, a buy signal is generated. (Afterward, when the short-term RCI rises above the first oversold line, no buy signal is generated.)
As described above, this indicator allows three levels for both the overbought and oversold lines, and uses the “Three-Stage Judgment,” which may reduce missed opportunities.
Additionally, by adjusting the periods of the three-line RCI and the three overbought and three oversold lines, you may find a chart setting that suits you.
https://www.gogojungle.co.jp/tools/indicators/24609