

Multi-timeframe High/Low Upward Breaks and Downward Breaks Bar Display Indicator How to Use ① << Retrace Sell pressure, Buy on Dips >>
■ Overview
Using the multi-timeframe high/low upper and lower bar display indicator,
we will introduce a strategy of selling on rallies and buying on dips.
■ Entry Points
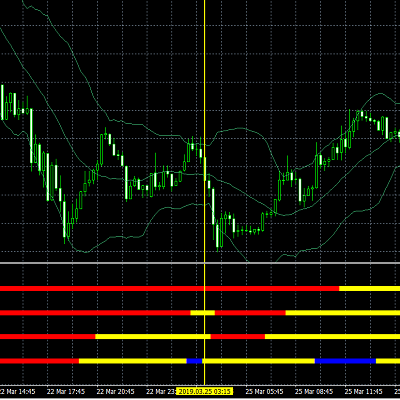
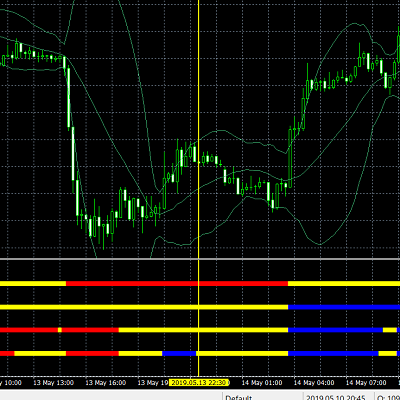
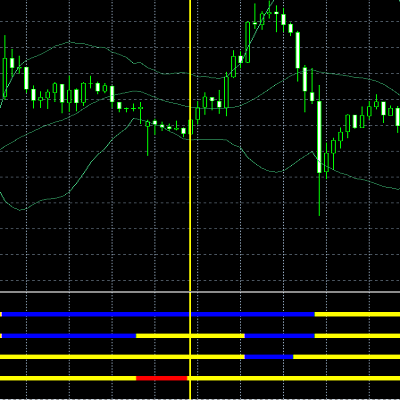
The indicator works across four timeframes,
When highs rises and lows rise --> blue bar
When highs fall and lows fall --> red bar
Otherwise in range --> yellow bar
.
*Buy entries
When a higher timeframe turns blue and a lower timeframe changes from red to yellow
*Sell entries
When a higher timeframe turns red and a lower timeframe changes from blue to yellow
■ Example
■ This indicator sales website
“Multi-timeframe (four timeframes) High/Low Rise/Drop Bar Display Indicator”
https://www.gogojungle.co.jp/tools/indicators/20259
■ EA Sales Site
The EA I created mainly uses the strategy of selling on rallies and buying on dips,
and has been steadily profitable since sales began.
“Senji Ban-Kuren” https://www.gogojungle.co.jp/systemtrade/fx/14944
“Sanji Suimei” https://www.gogojungle.co.jp/systemtrade/fx/15576
“Hana Kō Ryaku Ryakuryoku” https://www.gogojungle.co.jp/systemtrade/fx/17258
That is all.