[Video 66 seconds] The horizon that was stopped many times, will it stop again next time. Gold’s answer key
Verification Notes | Answer check with video (66 seconds, no sound)
A line that is stopped twice and then three times at the same price level is a strong resistance. This is a common concept seen in chart explanations. In this article, we replay in video the moment when a real 15-minute chart approaches the “twice-stopped line” for the third time, covering from 2015 to September 202637,425 times counted answers, shown in 66 seconds.
First, a quiz: it approached the twice-stopped line again. What comes next?
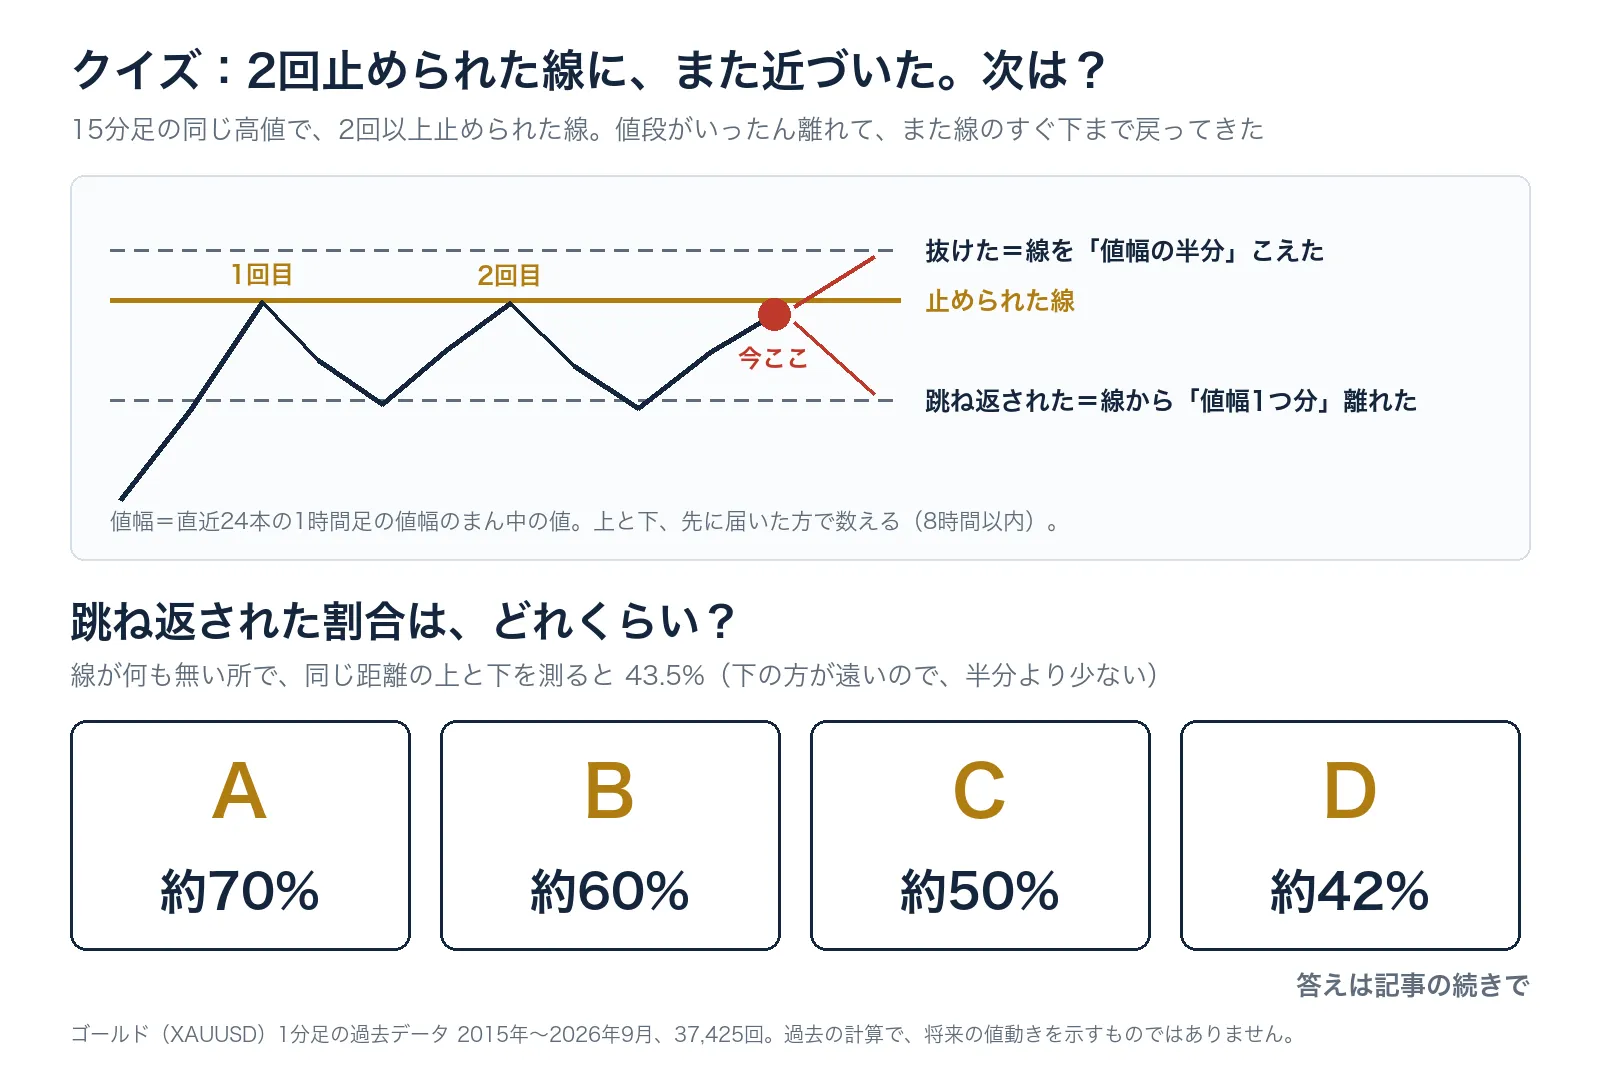
If the price rises above “half the price range”it breaks out, when it moves away from the line by “one price range,”it bounces back. We count based on which one arrives first. If you measure the same distance where there’s nothing on the line, the bounce-back side arrives first 43.5% of the time. Now,what is the bounce-back rate for lines that were stopped more than twice?
A: About 70% B: About 60% C: About 50% D: About 42%
In the continuation video, ① the moment of bounce-back at the third approachis shown andthe breakout moment for the 15-minute chart are played one by one, and ② the counted answer and ③ the result of viewing 12 years one year at a time are shown sequentially.
The answer is below in “Read more”for free. GoGoJyan free member registration is required (you can register with Google, Yahoo! JAPAN ID, or X account).