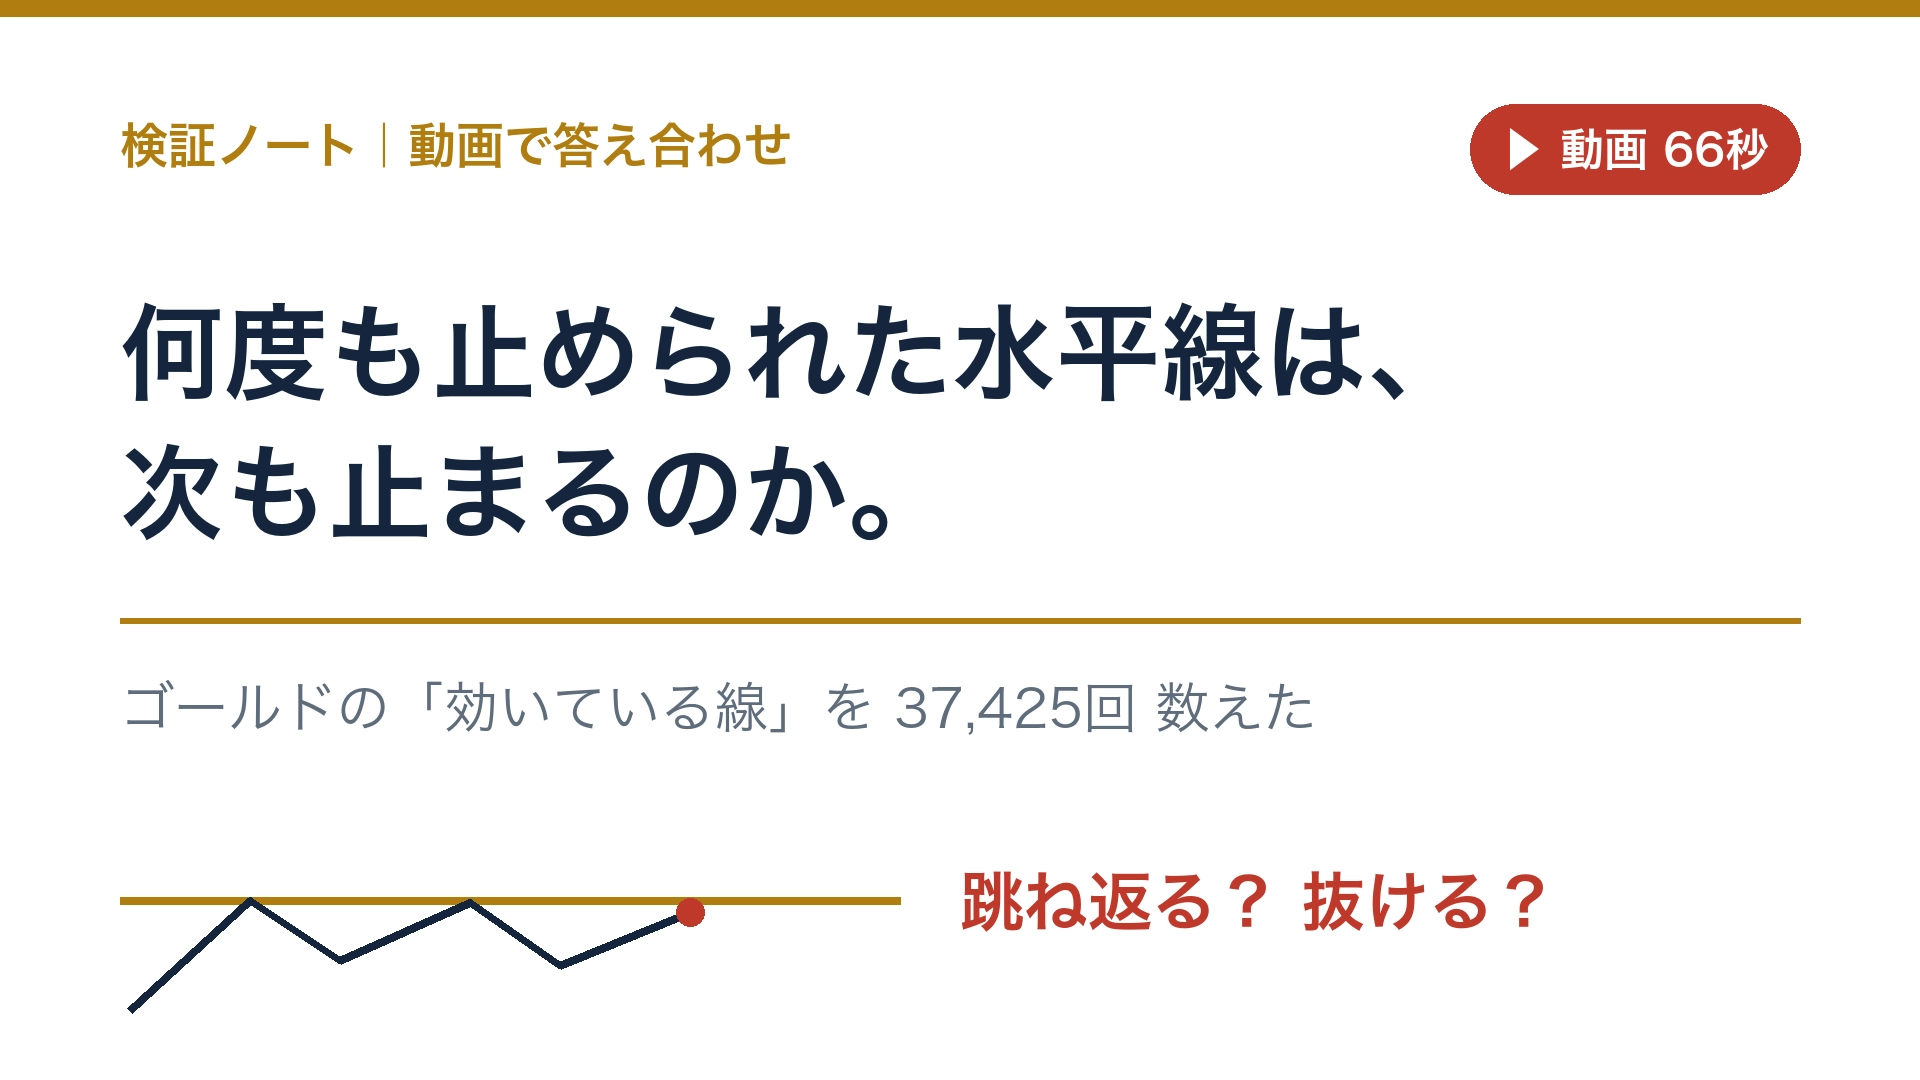
The horizon that was halted many times, will it stop again next time? The "effective line" in gold counted 37,425 times
Verification Notes — I counted the Gold “Common Sense”
In the same price, it stopped twice, then three times. Therefore, this is strong resistance. It’s a common way of thinking you’ll often see in chart explanations. On November 13, 2026, in the author’s chart, the 15-minute chart approached around 3,905 dollars three times and was stopped each time, causing a decline.
So, will the line that repeatedly stopped the price stop it again the next time it approaches? The author counted, from 2015 to September 2026, the moments when the price approached a line formed by the highs and lows on the 15-minute chart37,425 timesand compared it with when there was nothing on the line.
First a quiz: a line that was stopped twice approached again. What next?
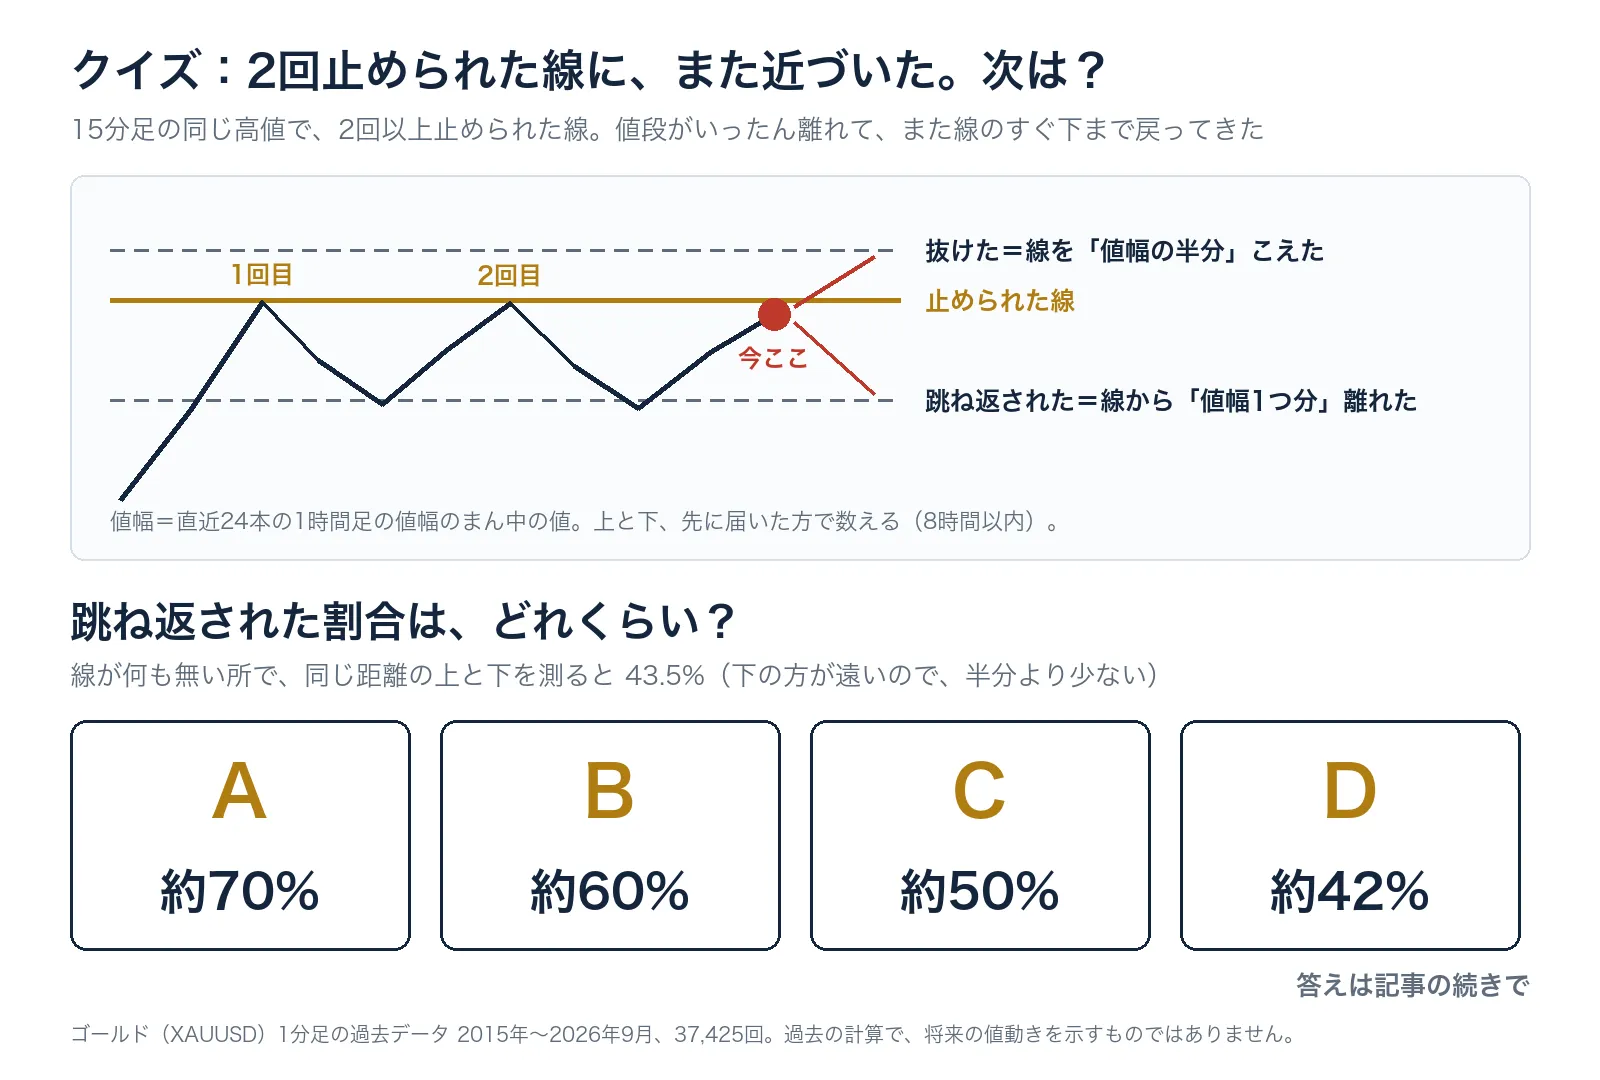
At the same high on the 15-minute chart,a line that was stopped 2 or more timesexists. After the price moves away, it returns just below the line again. From here, we count whether the price moves beyond “half the range” or moves away by “one full range” first. The range is the median of the ranges of the most recent 24 hourly candles. The low line was counted in the same way with the direction reversed.
When measuring the same distance in a line-free area, the side that bounces (the lower side) occurs first 43.5% of the time (since the lower side is farther away, it is less than half). Then,what is the bounce rate for lines stopped 2 or more times?How much?
A: about 70% B: about 60% C: about 50% D: about 42%
In the continuation, I provide the answer, the breakdown by the number of times it was stopped, the result of looking at 12 years year by year, andwhy the “stopped line” appears strong and how to verify it on your own chart.
The answer is below in the “Read more” sectionfor freeThe free sign-up for Gogojan is required (registration can also be done with Google, Yahoo! JAPAN ID, or X account).