

[October 13, 2026 Issue] Summary of This Week's Featured Articles
This Week’s Key FX Topics
The biggest focus this week is the US September CPI to be released on Wed the 14th. The consensus is +3.6% y/y, an acceleration from August’s +3.4%, but the probability of a rate hike at the October FOMC (27–28) remains around 20%, and many expect limited moves unless there is a substantial upside surprise.
A December rate hike is mostly priced in at over 80%, and market interest is shifting to whether “December will be the last, or hikes will continue into next year.” Even weak September jobs data didn’t break USD/JPY, supported by the Fed’s continued tightening stance and higher oil prices.
After being capped by the 200-day line in last week’s 157.44–158.51 range, USD/JPY rose to 158.75 in New York on the 12th. This week’s projected range is 156.50–160.00, with a pivot at 158.75 on the upside and 157.43 on the downside. Intervention fears intensify in the 159 area.
Oil surged on Middle East geopolitical risks, including a Houthi attack on Riyadh Airport. While inflation concerns and expectations for higher US rates spur dollar buying, there is also a risk-off bid for the yen. The US 10-year yield climbed to the 5.36% area, the highest since 2002.
EUR/USD may probe the downside amid France’s deteriorating fiscal situation and political turmoil (projected range 1.1050–1.1300). Domestically, attention is on the Bank of Japan Governor Ueda’s remarks (to be read by Deputy Governor Uchida) on the 16th for hints toward the late-October meeting.
This Week’s Curated Articles

Global Markets & Middle East Deep Dive: Hormuz tanker attack, crude at $104, US yields in the 5.2% range — the “risk-on dollar” and Japan’s holiday thin liquidity set a trap near USD/JPY 158
With tensions rising in the Middle East, why is the safe-haven yen being sold while oil, the dollar, and stocks all rise together? This comprehensive report maps transmission from military events to oil, bonds, and FX, and lays out trading scenarios for this week ahead of the US September CPI.

Even if your bias is right, why you shouldn’t enter: Measure the buffer to the barrier first
You called the direction correctly but got pushed back at the nearby high — reframe those losses not as a “direction” issue but a “proximity” problem. We introduce a simple yardstick: compare two lines — distance to the wall and distance to where you’d exit.
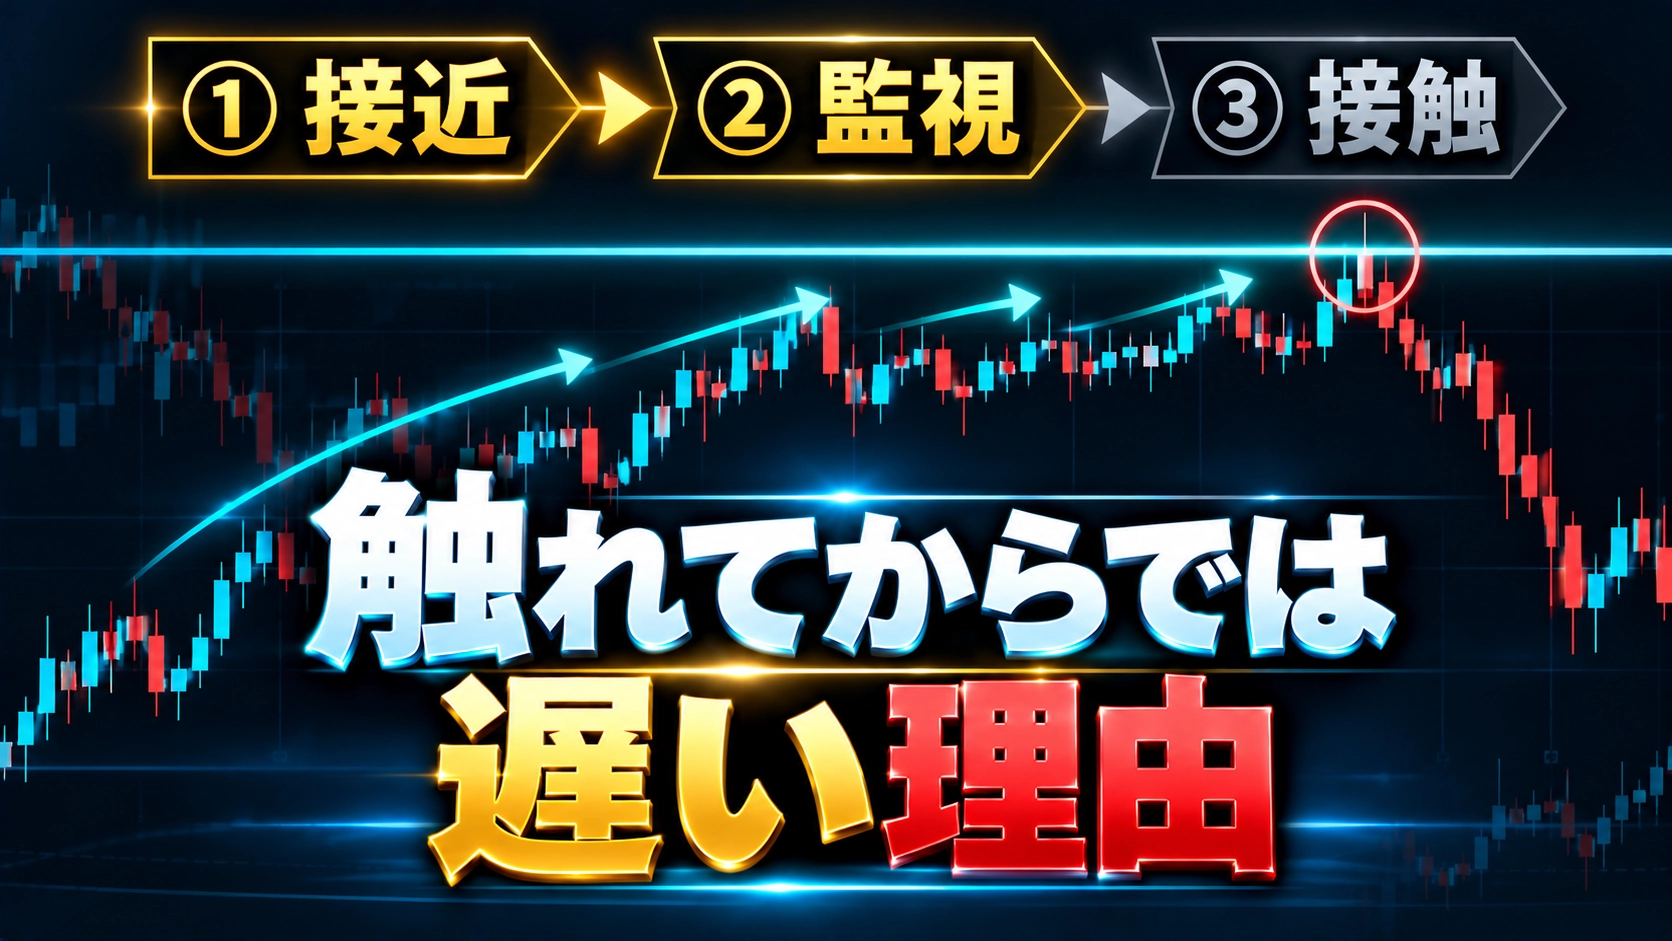
Part 3: In short-term horizontal-line trading, moving “after it touches” is too late
Waiting for price to touch the line or for a signal often lags on lower timeframes. This third installment of the horizontal-line refresher explains the 3 stages — approach → monitor → first touch — and how to prepare before price arrives.

Command the market with areas, not points!
Entering right at the bottom only to reverse slightly and get stopped out — then it moves as expected. The frustration often comes from trying to hit turning points as “dots.” This piece shares a pro mindset: capture tops and bottoms as “areas.”
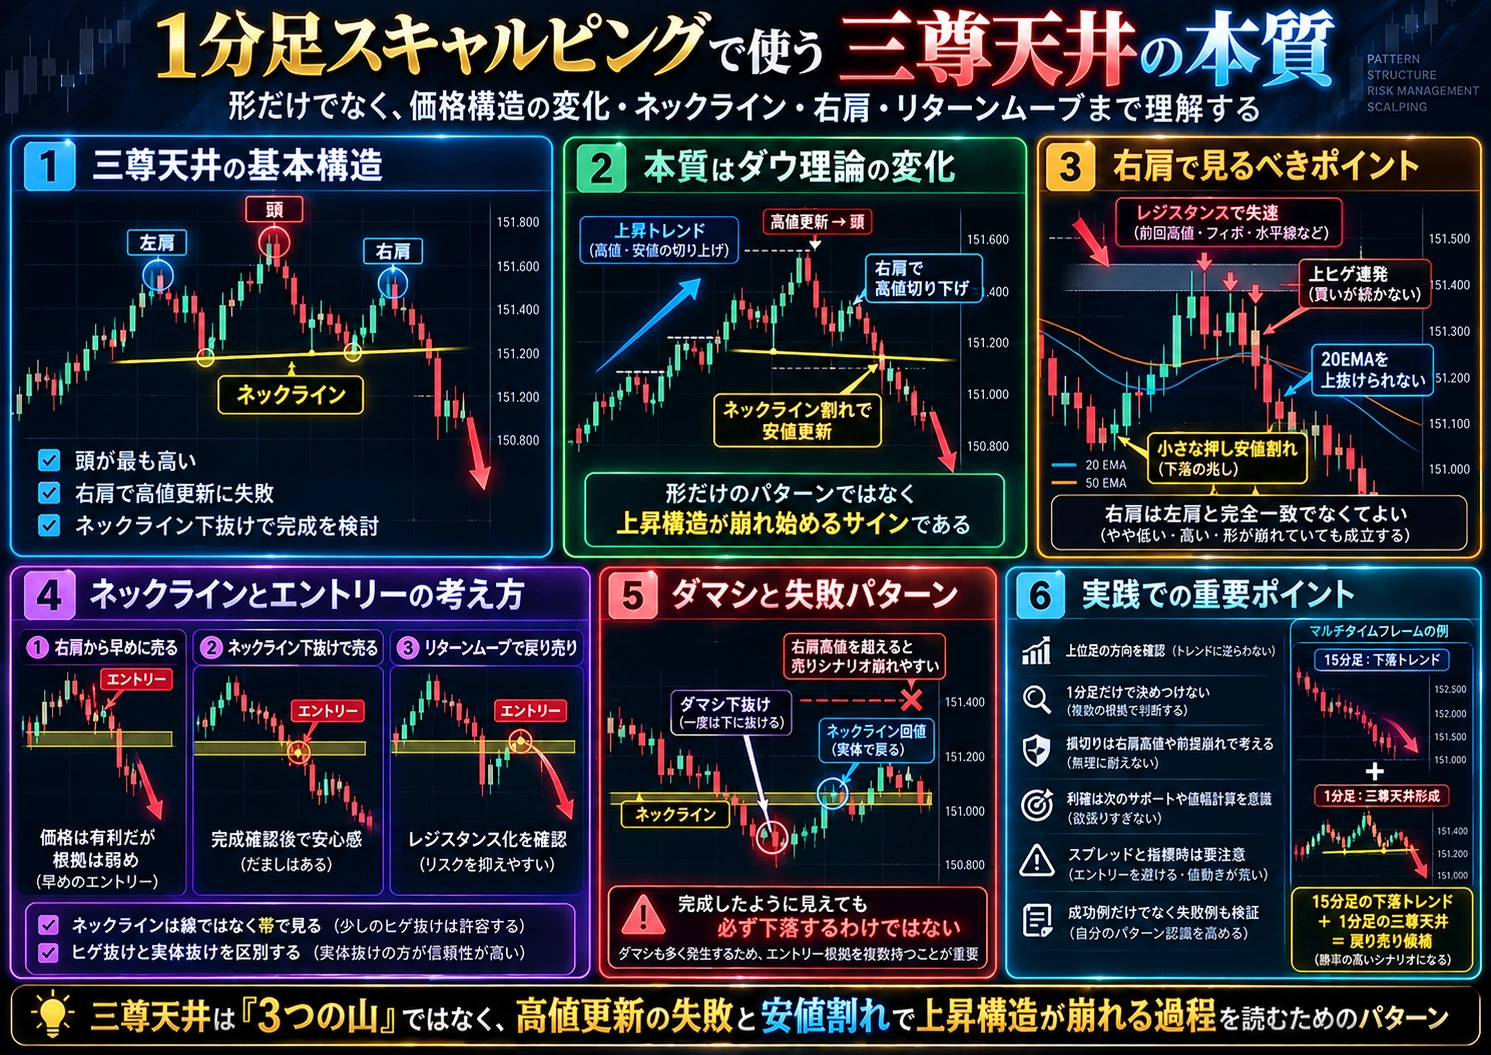
FX 1-minute scalping staple method: Pro trader Shota explains Head and Shoulders (triple top) in an easy-to-understand way
Interpret the triple top not as “three peaks,” but as a trend-structure shift through Dow Theory. We dig into practical 1-minute points: the right shoulder’s internal structure, neckline slope, return moves, and fakeouts.

Why “buying the high” and “selling the low” happen on Gold 1-minute
Using about 3.39 million 1-minute Gold bars from 2017 to Aug 2026, we test why chasing often fails. Combining candle shape, capital flow, and time-of-day “crowds,” we attempt to condense the buy–sell tug-of-war into a single metric.

Why do GOLD pullback buys fail there? Four angles to compare the “rise before the pullback”
Even with the same 50% retracement, a wave that moved one-way in bodies differs from one that whipsawed. Based on an MQL5 study, we outline schematic views to judge the “quality” of the rise before the pullback.

GOLD scalping: A simple SMC intro — Why countertrend top/bottom picking loses. A simple play targeting only big players’ “order imbalances”
Why value-based countertrends get hunted — explained via Smart Money Concepts (SMC). We introduce two personal rules to “wait” for the first touch into institutional imbalance (FVG) and a confirmed 1-minute reversal.

30-Second FINAL: Even if higher-timeframe bias is sell, you can still buy. Balance higher-timeframe “confidence” with short-term initiation
Even when higher timeframes align, the current 30-second chart may not move that way. We explain using background color not as an absolute trade direction, but as a filter to narrow scenarios, and how to define end-of-day rules.

The truth: “Studying more” doesn’t automatically mean “winning more”
You’ve learned more but still can’t win — perhaps you’re confusing “study” with “practice.” This column warns against making knowledge-gathering the goal and argues for deeply mastering a single method.

Customer Voices: There’s a reason when results change. One insight that led from losing streaks to winning streaks
A user struggling with consecutive losses turned results around by returning to basics: trading only in the higher-timeframe trend direction. It underscores practicing what you’ve already learned over seeking something new.
It might be your eyes: Why those who stare at Gold 1-minute charts for hours miss crucial signals
Missed signals may stem not from poor focus but eye strain and hard-to-read screens. We organize tips for a screen setup that keeps decisions consistent over long sessions: color coding, background, and viewing order.
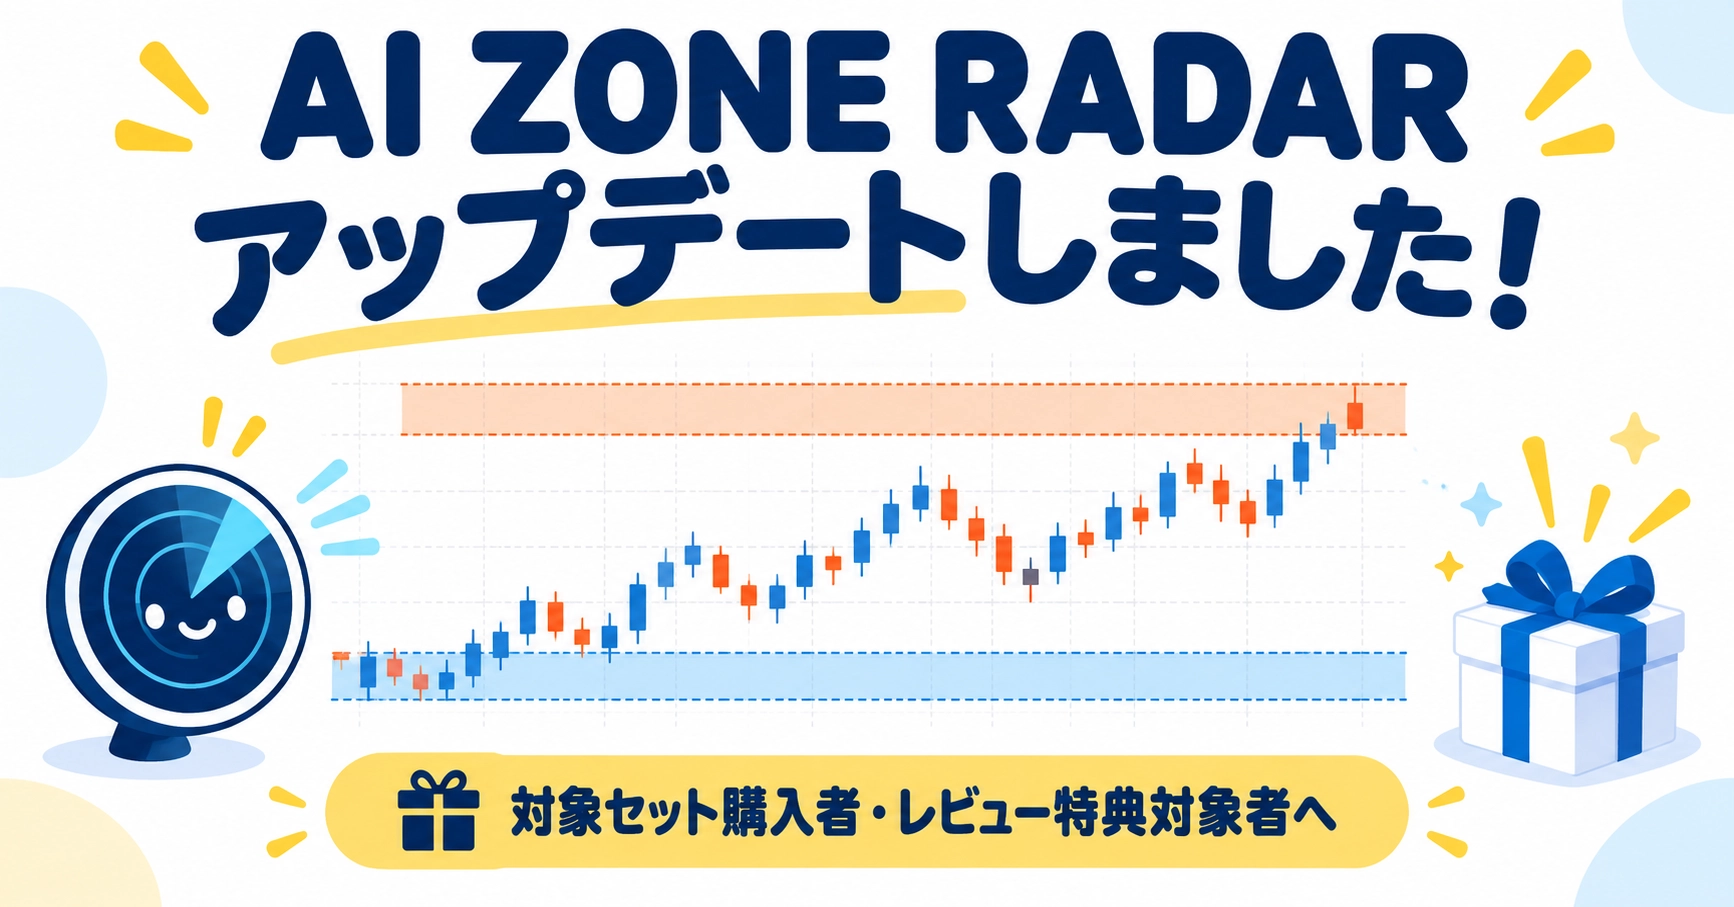
Update: AI ZONE RADAR gets easier to read. Get the latest version with eligible set purchase or review
Beyond signal arrows, this indicator helps confirm surrounding support/resistance zones. We outline improvements such as banded zone display, panel movement, and compact mode on split charts, plus a limited-time update offer.
For deeper learning — Featured paid series
 Paid Series
Learn for less than a coin a day! Highly repeatable GOLD trading method
The practical edition of the GOLD Quick-Relief Manual. A series explaining high-reproducibility entry logic and real trade points, for less than a coin per day.
 Paid Series
Why does the market stop there? Bollinger Bands × Harmonics — Pinpoint turning points with a fusion of statistics and geometry
Bollinger Bands × Harmonics! Target market turning points with a fusion of statistics and geometry.
 Paid Series
Entering the world of crypto — Practical investment methods and useful knowledge
A step beyond free articles: a series delivering key knowledge, undisclosed coins, and market trends about four times a month.
What is Investment Navi+?
Covering a wide range of investment themes
From market views on FX, stocks, and crypto assets to trading methods, investment mindset, and risk management. Investment information you can read within GogoJungle.
Written by sellers and experts
GogoJungle sellers and investment experts publish their own insights as articles, delivering reliable content written by proven professionals.
Use it as a gateway to learning
From free articles to paid series, choose based on your learning depth. Updated weekly as a themed feature, delivering this week’s highlights.