
Summary of representative discretionary trading methods — 7 ways of thinking and how to practice each
Introduction
When researching discretionary trading methods, you’ll encounter many names. Breakouts, buying on pullbacks, counter-trend, trend following, and more.
Reading the explanations may make you feel you understand. However, when you actually sit in front of a real chart, you can’t tell whether the moment is the right one.
This article lays out seven common ways of thinking and summarizes the difficult partsandwhat to look for in practice. It doesn’t say which method is best; it explains how to practice to find what suits you.
What you’ll learn in this article
- Seven commonly used ideas in discretionary trading
- Parts of each method that are hard to judge in the moment
- A practice approach common to all methods
Overview of the Seven Ways
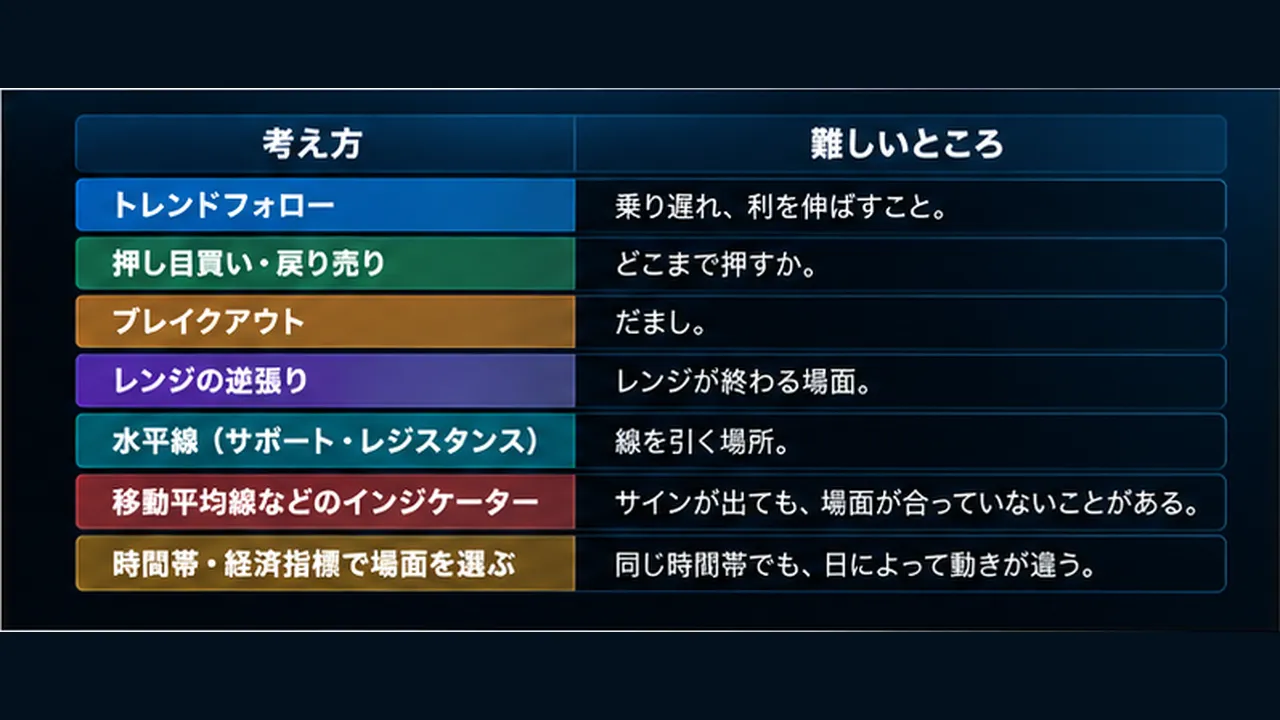
- Trend Following:Getting in after missing the move, and letting profits run
- Buying on Pullbacks / Selling on Rallies:How far the pullback goes
- Breakout:Dealing with false breakouts
- Counter-Trend in a Range:When the range ends
- Horizontal Lines (Support/Resistance):Where to draw the lines
- Indicators such as Moving Averages:Signals may not fit the current scene
- Choosing the Scene by Time Zone and Economic Data:Movements vary by day even in the same time window
(Notes after the colon describe the respective difficult parts)
None of these guarantees success simply by following a rule. Here, they are listed as practice topics for you to explore.
1. Trend Following
This is the idea of riding the current up or down by moving in the same direction as the trend.
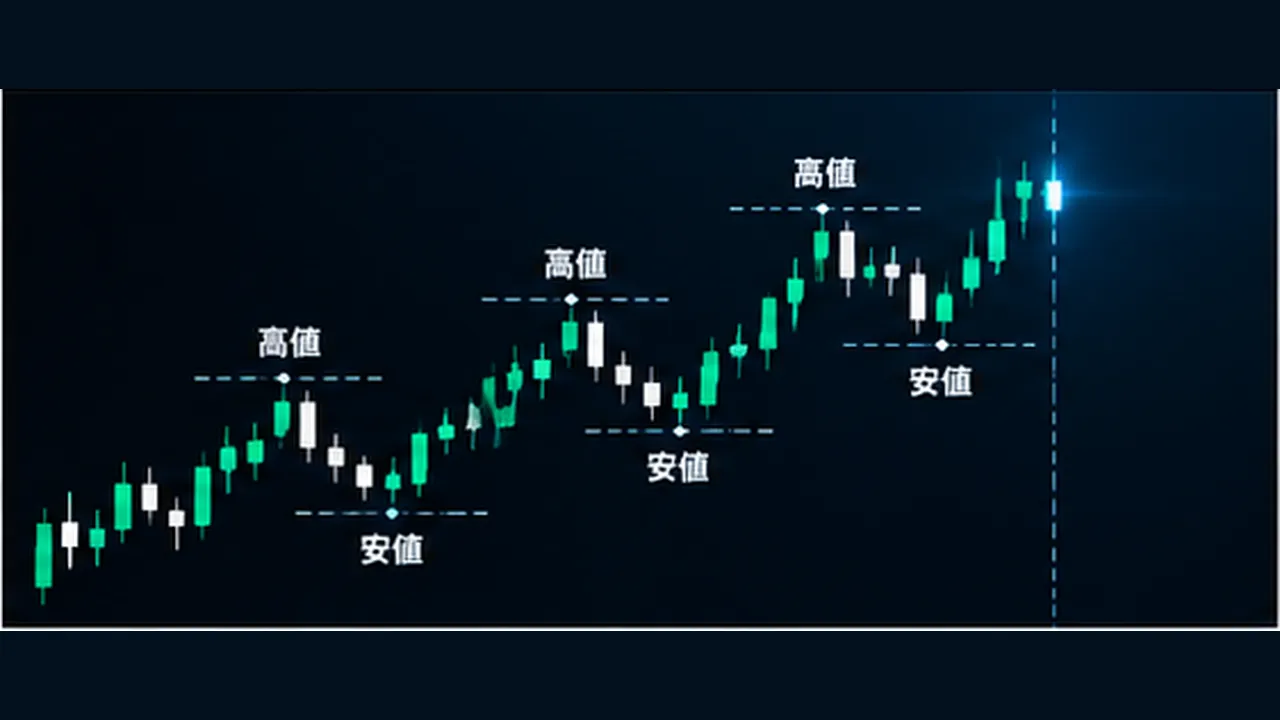
- Difficult parts:By the time you realize the trend, the move has already progressed. Even after entering, you may hesitate on where to take profits.
- What to look for in practice:Before entering, write down why you think the trend will continue. Compare the profit-taking point with subsequent price action.
2. Buying on Pullbacks / Selling on Rallies
Wait for temporary counter-moves (pullbacks or rallies) within the trend, then enter in the direction of the trend.
- Difficult parts:Where a pullback ends is not knowable in the moment. Waiting too long may cause you to miss the move; waiting too early may get you caught in a pullback.
- What to look for in practice:Write in advance the entry point and the conditions to pass on, and count whether you wait too long or enter too early more often.
For more detail, see this article.
▶ What is Buying on Pullbacks / Selling on Rallies — Practice “How far to pull”https://www.gogojungle.co.jp/finance/navi/articles/127183
3. Breakout
Enter in the breakout direction when price breaks above the previous high/low or the price range’s upper/lower bounds.
- Difficult parts:A breakout can appear to happen but then quickly reverse (a false breakout). At the moment of breakout, it isn’t yet known whether it’s real or false.
- What to look for in practice:Before entering, write down the reason it is real or false, and look for common features in the false-breakout moments.
For more detail, see this article.
▶ What is Breakout Strategy — “False Breakouts” and Practicehttps://www.gogojungle.co.jp/finance/navi/articles/127082
4. Counter-Trend in a Range
In a market moving within a defined range, sell near the top and buy near the bottom.
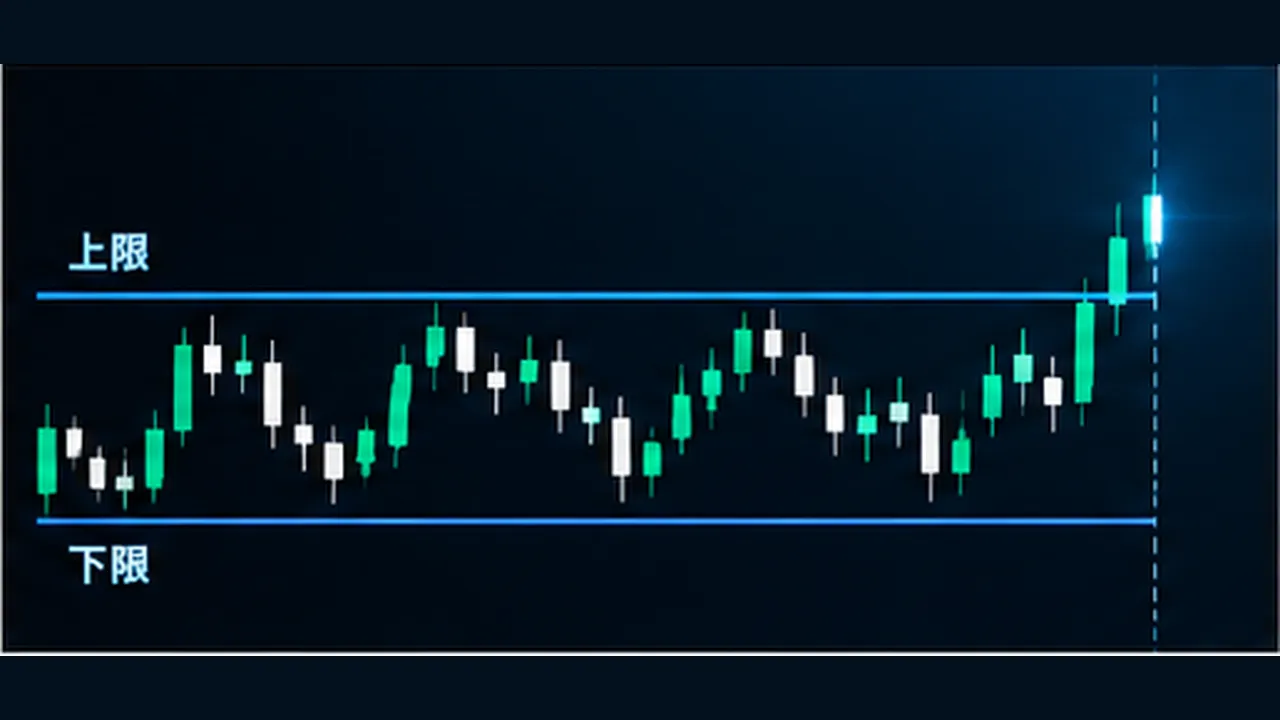
- Difficult parts:Ranges eventually end. When they end, price often moves strongly in the opposite direction to the counter-trend.
- What to look for in practice:Decide in advance the conditions to call the range finished and where to place stop-losses.
5. Horizontal Lines (Support/Resistance)
Draw horizontal lines at price levels where price has repeatedly been stopped, and judge price action near those lines.
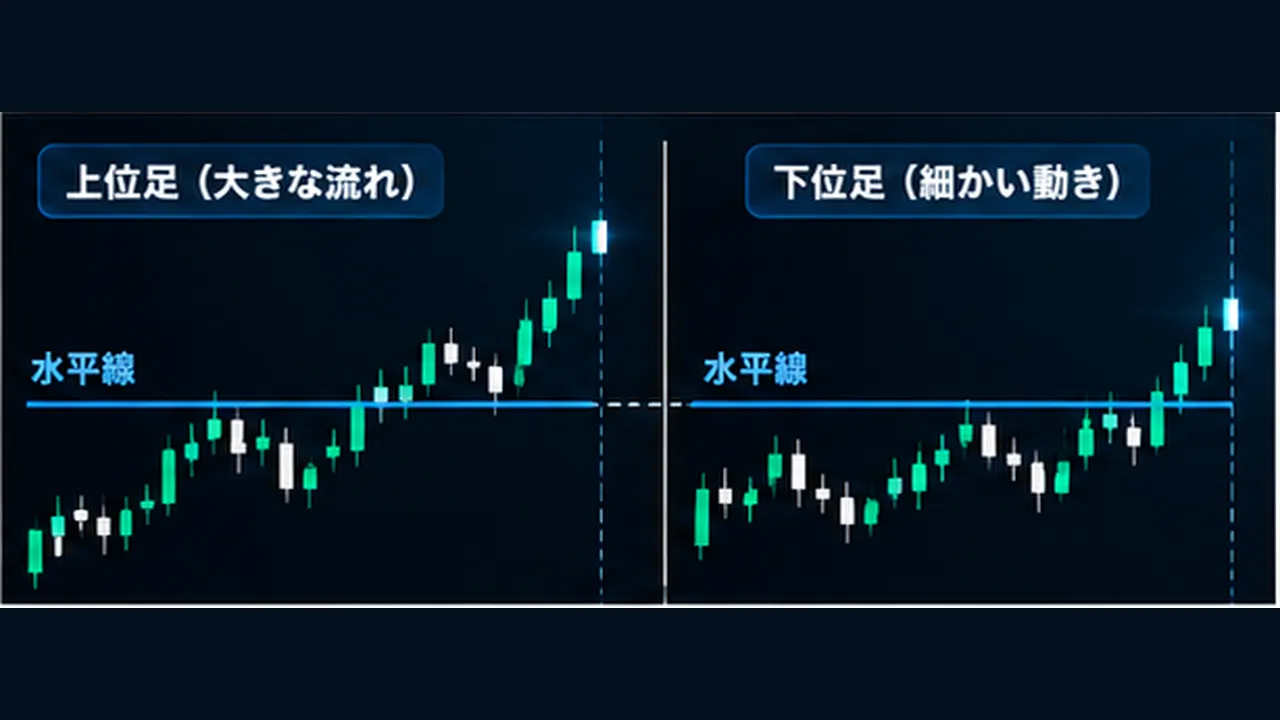
- Difficult parts:Where to draw the lines varies by person. Drawing too many lines can make every line seem meaningful.
- What to look for in practice:Write down why you drew each line, and record whether price actually stopped or broke through at that line.
6. Indicators such as Moving Averages
Use indicators like moving averages, Bollinger Bands, and RSI to judge the trend and whether the price is overextended.
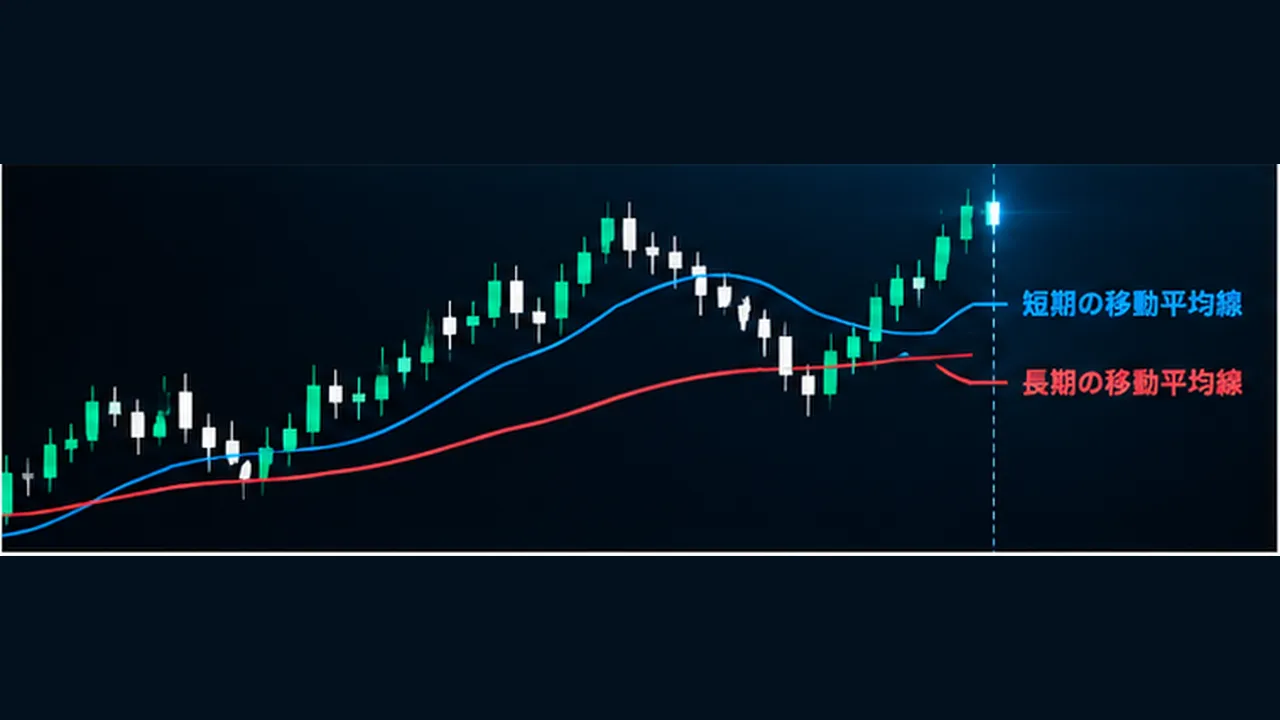
- Difficult parts:Even with the same signal, subsequent price action can differ depending on whether a trend is present.
- What to look for in practice:Don’t enter on a signal alone; first note what kind of moment you’re in, then enter.
7. Time Zone and Economic Data to Choose the Scene
Trade by choosing moments when price tends to move, such as certain times of day or around economic data announcements.
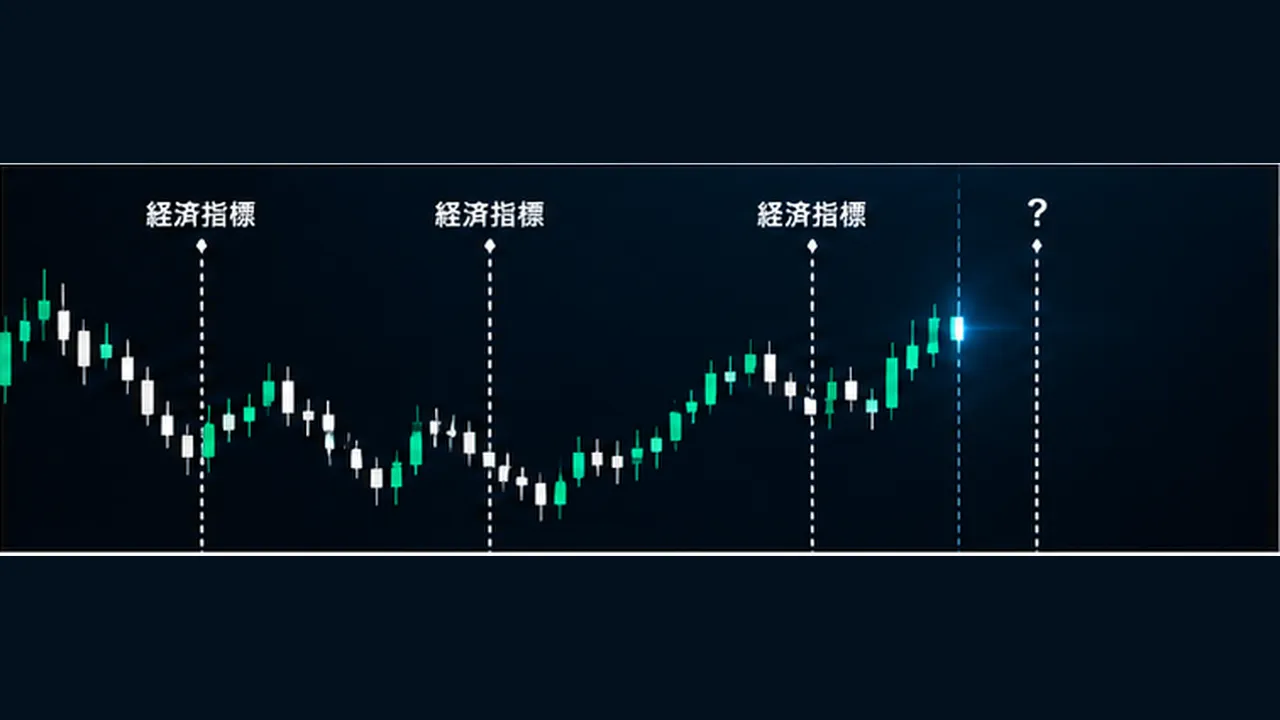
- Difficult parts:Even in the same time window, day-to-day movements can vary. Data releases immediately after can cause big swings.
- What to look for in practice:Divide by time zone and data release, and see which scenes your judgment aligns with most.
All methods are learned by the number of scenes you study
All seven ideas are understandable by reading their explanations. The hard part is judging, without knowing the future, whether the scene before you is the one right now.
Looking back at past charts, you can quickly find scenes where any method would have worked, because you can see what happens next.
The reason why practice cannot rely on seeing ahead is described in detail in this article.
▶ The reason why seeing ahead makes practice ineffective — three scenes where hindsight detracts from forward testinghttps://www.gogojungle.co.jp/finance/navi/articles/126818
Common Practice Steps for All Methods
- Choose one method and write its rule in sentence form:Specify which time frame, what scene, where to enter, and where to place the stop
- Pause at a scene and write the decision and reasons in advance:Whether to enter or to pass, and why
- Move forward one candle at a time and judge the result, marking a check or cross:Do not amend what you wrote earlier
- Accumulate the number of scenes:For one method, see many scenes that satisfy the same rule
- Look for commonalities in scenes that didn’t fit:Decide whether to adjust the rule or avoid that scene
The stop-loss location will be decided in advance for any method. A summary of approach and practice is provided in this article.
▶ How to determine stop-loss placement — Place it at a justifiable levelhttps://www.gogojungle.co.jp/finance/navi/articles/127283
Practice with Tools
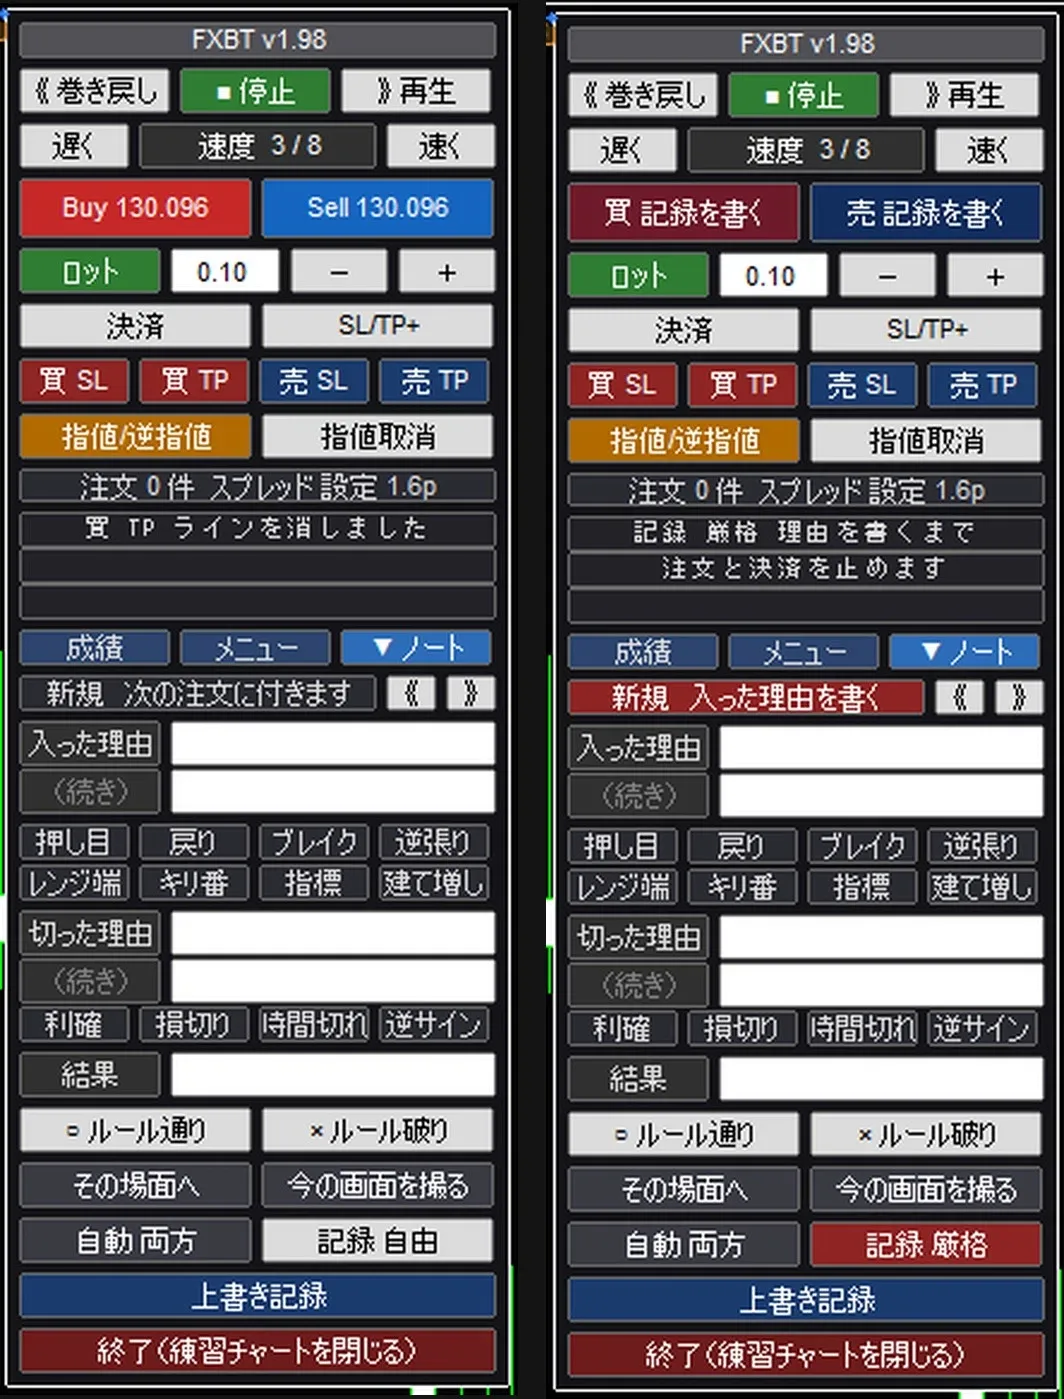
The MT5 indicator “FX Past Verification Trainer” is a practice tool that replays past charts one by one and allows simulated orders and recording in a demo account.
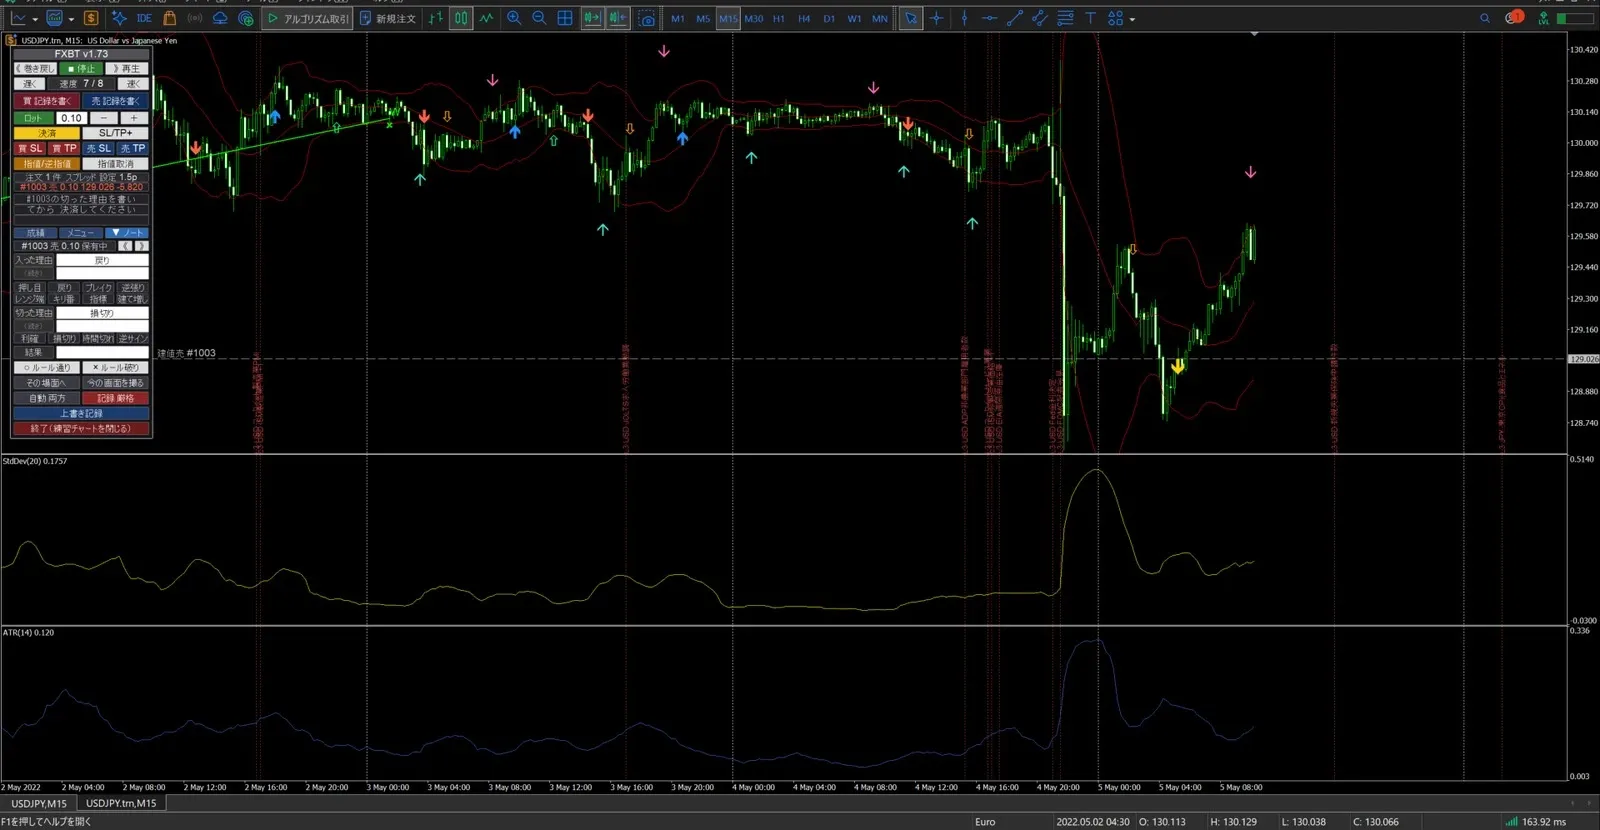
- There is no data for future candles, so the results of scenes are not visible until replaying
- Your usual indicators and color schemes appear as-is on the practice chart (some indicators may not be usable)
- You can align up to three higher time frame charts for the same currency pair and run them at the same time. Lines you draw by hand appear on other screens as well
- Economic indicators appear as vertical lines on the chart. Indicators beyond the current replay time will be shown with their results hidden
- In the Trade Note, you can record your entry reasons and exit reasons, and later review with check marks
Some things cannot be done.
- There is no function that tells you which method is best. You decide.
- Some indicators that read other symbol names directly, or indicators that rely on actual dates and times, may not be usable. Please verify with the free version
- The time is server time (no switch to Japanese time)
- Fees and swaps are not included in calculations. Account currency is Japanese Yen only, and compatibility is MT5 (Windows) only
Instructions for practicing with this tool in MT5 are summarized in this article.
▶ How to perform past verification in MT5 — Pitfalls of manual scrolling and practice playing one candle at a timehttps://www.gogojungle.co.jp/finance/navi/articles/126682
Summary
- Representative discretionary-trading ideas are seven: Trend Following, Buying on Pullbacks, Breakouts, Counter-trend in Ranges, Horizontal Lines, Indicators, and Time/Zones
- Explanations are easy to understand, but the hard part is judging “whether the moment is the right one” without knowing the future
- Choose one method, write its rule in words, and accumulate practice with scenes where you don’t know the future
Related Articles
From the meaning of past verification, the overall flow from manual methods to tools, recording, and reviewing.
▶ What is FX past verification (backtesting)? How-to, procedures, and ongoing practice — full guidehttps://www.gogojungle.co.jp/finance/navi/articles/126878
For more practice methods in MT5, including demo accounts, testers, and past verification, and their suitability.
▶ Summary of practicing discretionary trading in MT5 — Using demo accounts, testers, and past verification appropriatelyhttps://www.gogojungle.co.jp/finance/navi/articles/127097
About the Practice Tools
The practice introduced in this article is possible with the MT5 indicator “FX Past Verification Trainer.” It replays past charts one by one and enables orders, recording, and review in a simulated account.
A 7-day trial version is available.All features can be tried for 7 days without usage restrictions.
This lets you first confirm whether it runs on your MT5 and whether your usual indicators work.
▶ Trial version (Product ID 87387)
https://www.gogojungle.co.jp/tools/indicators/87387
If you want to continue practicing, please see the full version.
Notes and saved verifications from the trial can be opened in the full version as-is.
▶ Full version (Product ID 86765)
https://www.gogojungle.co.jp/tools/indicators/86765
Cautions
- This tool is for practice. It does not guarantee profits. No actual orders are placed.
- This article introduces practice methods. It does not recommend specific buying or selling or any particular method.