
![【English Version】[MT4] Multi-Perspective Pivot Analysis インジケーター・電子書籍](https://cdn.gogojungle.co.jp/img/products/71713/medium)


📈 Overview
This is an MT4 signal tool (indicator).
Thank you for checking it out among the many tools available!
Free trial (demo) download:
[MT4] Trial: Auto-Drawing Pivot Lines Indicator
https://www.gogojungle.co.jp/tools/indicators/71680
↑If you can install and display the trial indicator, you can use this tool as well.
When installed, the indicator behaves as follows:
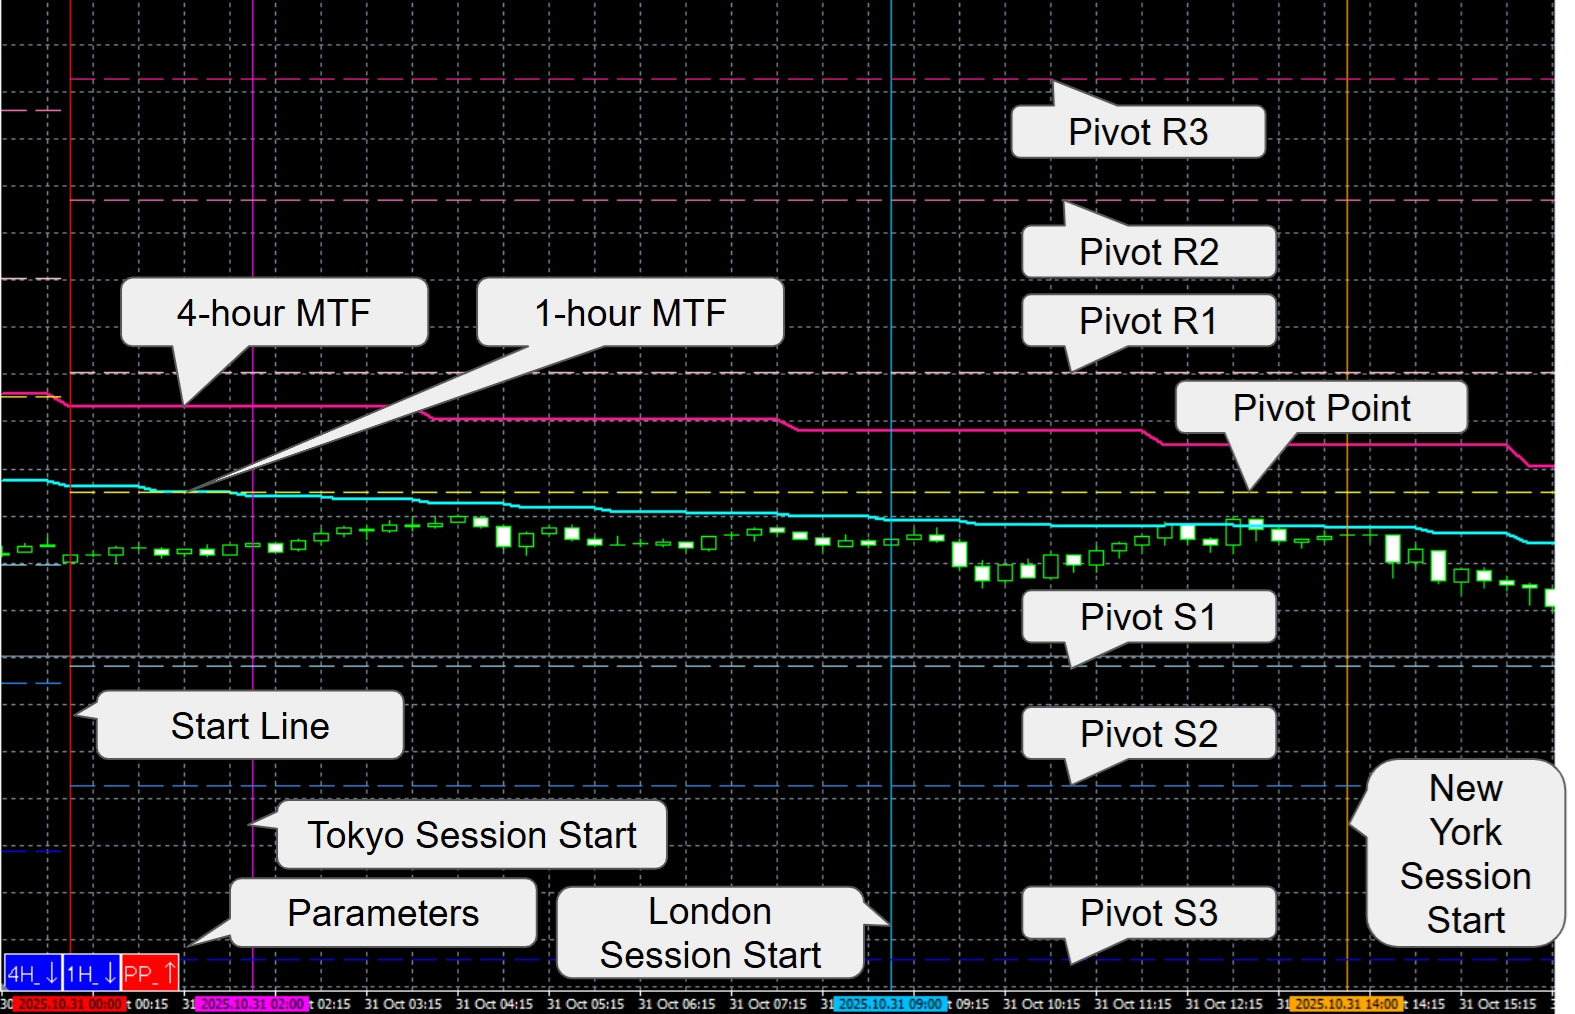
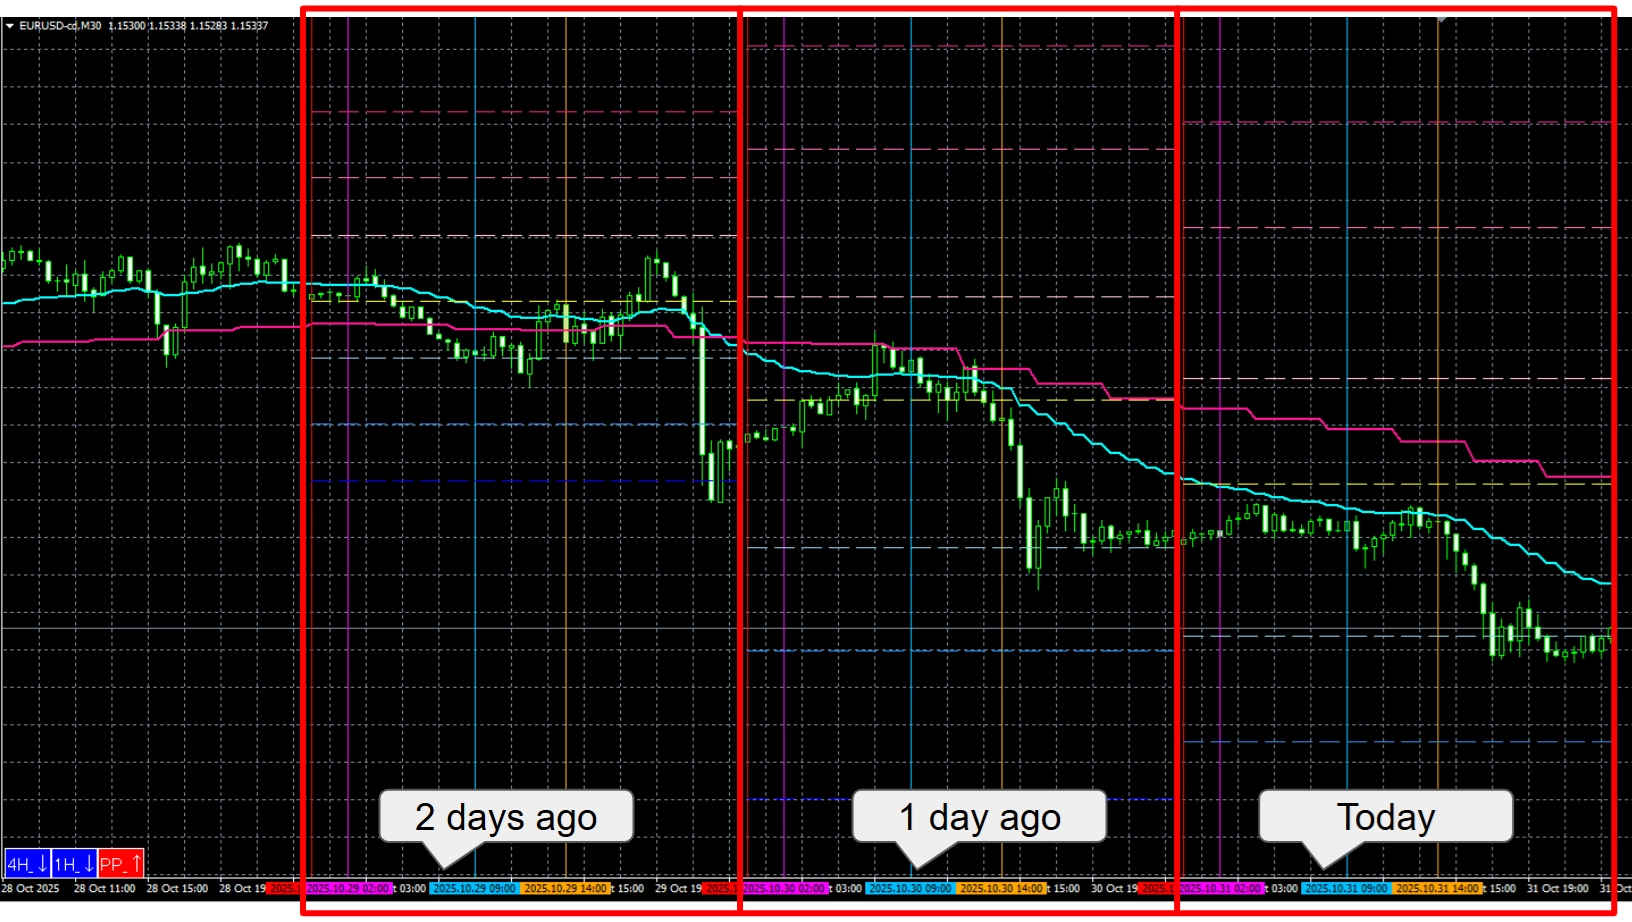
①Automatically draws vertical lines on the chart for the day’s start time and the session start times for Tokyo, Europe, and New York.
②Automatically plots the 20 EMA (changeable) for H1 and H4 as multi-timeframe (MTF) moving averages. ③Automatically draws pivot lines for today’s chart using the previous day’s high/low/close with these formulas: P (Pivot) = (High + Low + Close) / 3 R1 = 2 * P − Low S1 = 2 * P − High R2 = P + (High − Low) S2 = P − (High − Low) R3 = High + 2*(P − Low) S3 = Low − 2*(High − P) These pivot lines are drawn automatically for three days. (All pivot calculations use the previous day’s high and low as the basis.) (Example: If today is 10/31, the pivot lines shown on 10/29 are calculated from 10/28’s high and low.)
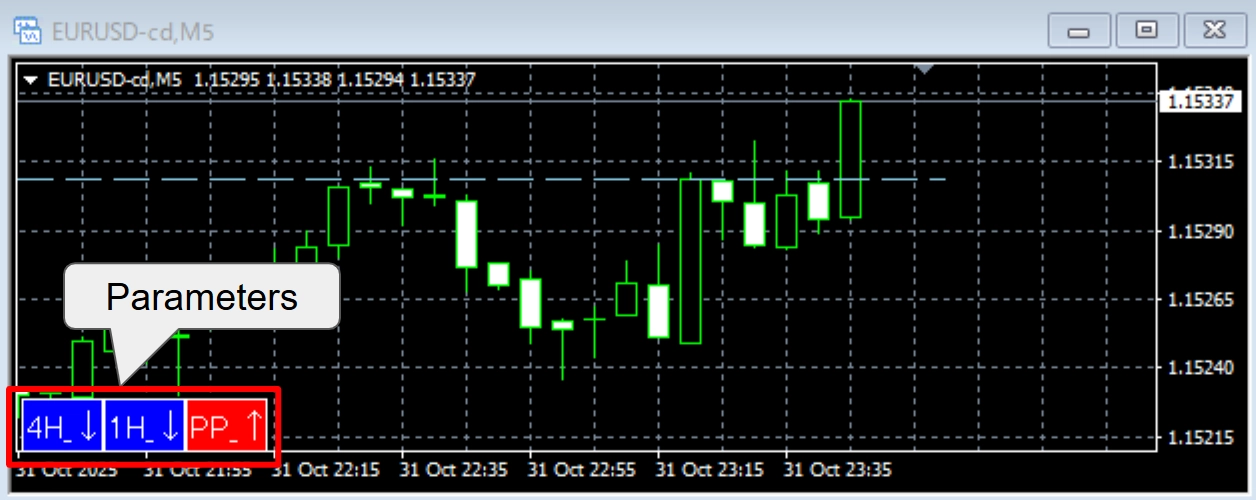
④Displays key parameters in a small window at the lower left of the chart.

Lower-left parameter window explained ・Left column — 4H_↑ / 4H_↓: indicates whether the previous candle’s close is above or below the 4H MTF MA (the example image shows it below). ・Center — 1H_↑ / 1H_↓: indicates whether the previous candle’s close is above or below the 1H MTF MA (example shows below). ・Right — PP_↑ / PP_↓: shows whether P→R1 is wider or P→S1 is wider (the example shows P→R1 is wider).
In short: when the arrows align in the same direction, that direction represents a stronger bias to consider for entry.
✅ Do any of these problems sound familiar?
・You want to trade, but you don’t know which direction has the edge.
・You know horizontal lines are important, but you’re not sure where to draw them.
・Signal indicators produce too many false signals (“whipsaws”).
・You jump in too early on pullbacks and keep hitting stop losses.
・You close profitable trades too early and later see the market extend further. If any of the above applies, this indicator can become a powerful tool in your toolkit.
📊 Four key strengths of MTF_Pibo (this indicator)
① Determine direction with multi-timeframe clarity
Displays the 20 EMA on the 1-hour and 4-hour charts (period adjustable). This makes trend direction and the preferred market bias easier to determine. The lower-left panel shows whether the previous candle’s close is above/below the 1H and 4H MAs using arrows — making the direction visually clear.
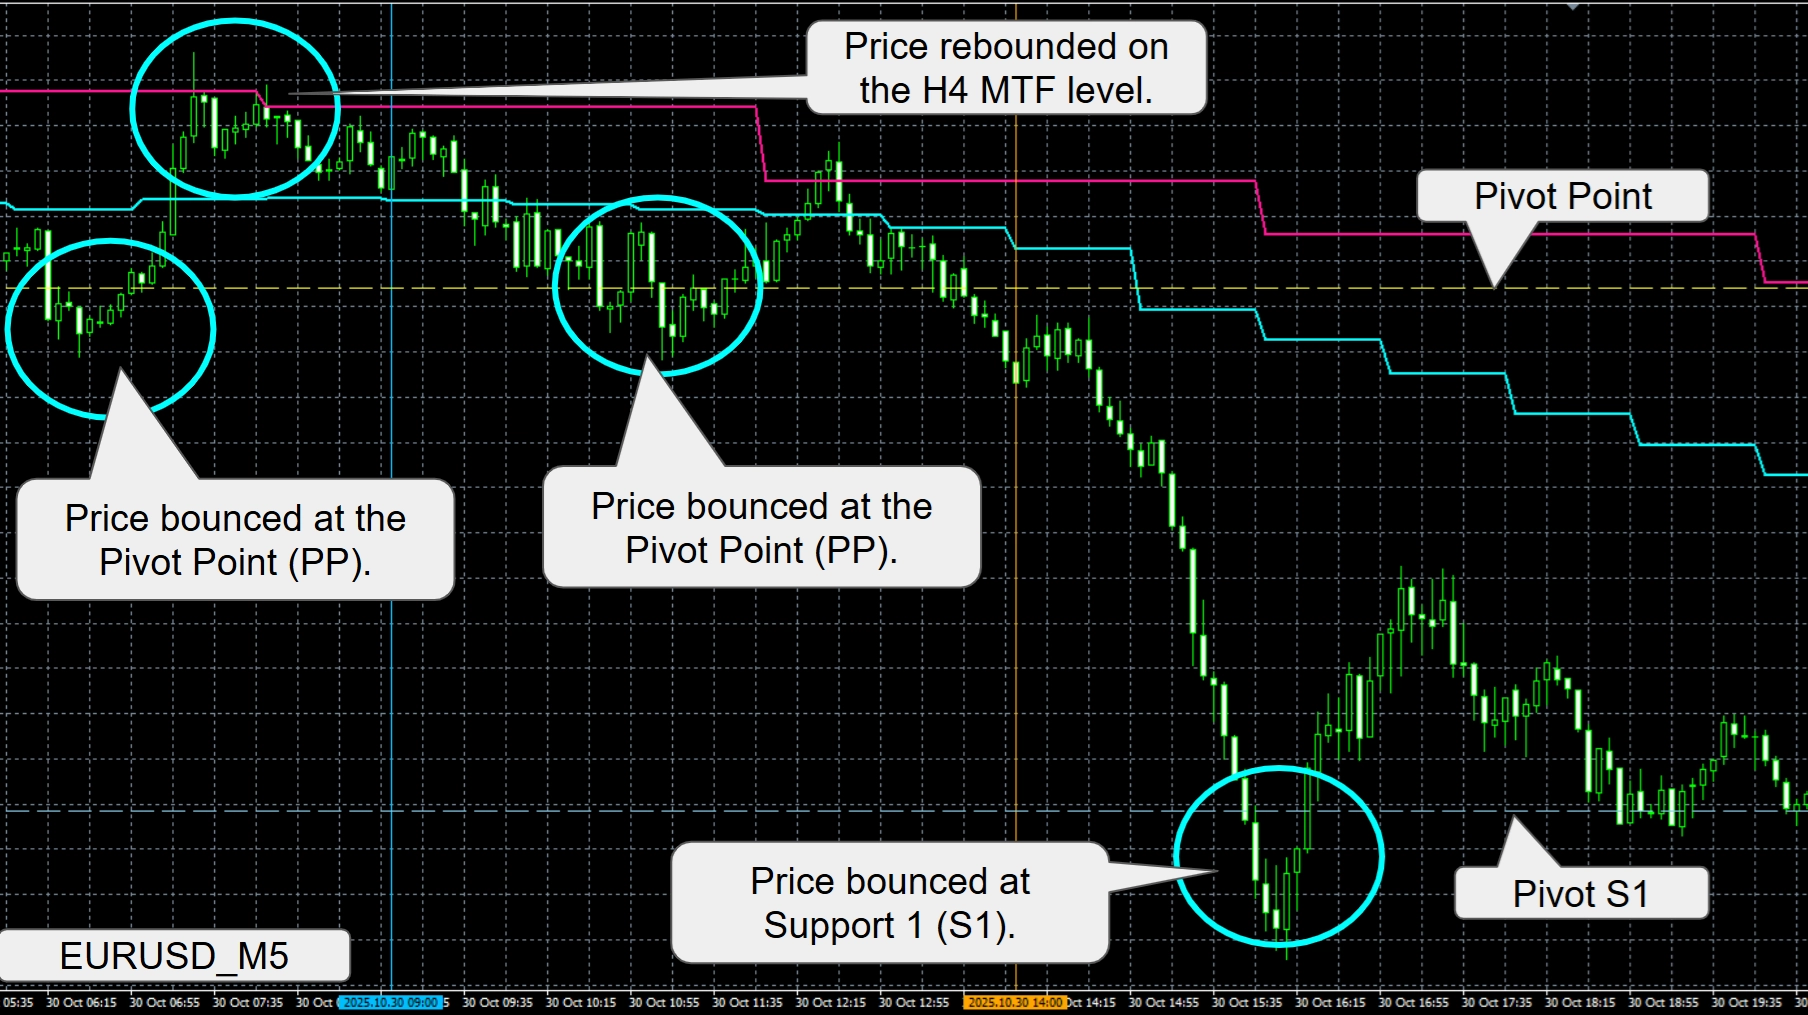
② Automatic pivot line drawing
Automatically calculates previous day high/low and draws the pivot lines on today’s chart. This shows target lines, pullback/retracement points, and reversal candidates — helping you identify when to attack the market.
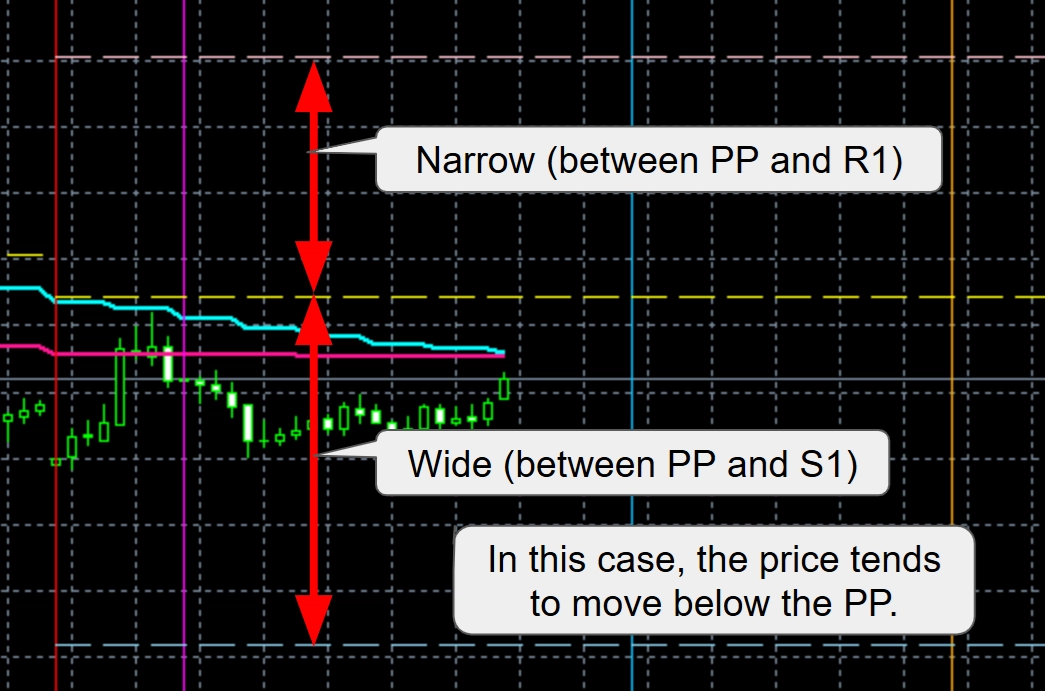
③ Identify which pivot side is dominant Using the pivot calculations described above, you can infer which side is likely to be stronger on the next day based on the previous close position: ・PP_↑ (P→R1 wider) — suggests upside bias for the following day. ・PP_↓ (P→S1 wider) — suggests downside bias for the following day.
Summary table Comparison State Market psychology / Next-day tendency P−S1 narrow / P−R1 wide Close biased toward high (bullish candle) Bullish — likely to continue higher next day P−R1 narrow / P−S1 wide Close biased toward low (bearish candle) Bearish — likely to continue lower next day
④ Backtest visually for the past two days
The indicator auto-draws the start lines and session start lines (Tokyo/Europe/New York) for today, yesterday, and the day before yesterday. Each day’s pivot lines are calculated from the previous day’s high/low, so you can visually verify how pivot zones played out across three days without the lines disappearing.
✅ Why we’re particular about pivot lines
Stable, pre-defined lines that many traders reference provide reliable benchmarks across the trading day. Drawing lines off rapidly changing candles can introduce bias. By plotting commonly used pivot lines (based on prior high/low), you can form objective trading strategies — e.g., “price reached this pivot gap, so a reversal may occur” or “price cleared this line; take profits at the next pivot.” FX does not always repeat the same move, so plan, analyze, and trade with a strategy. Because MTF_Pibo draws pivot lines from the previous day’s high/low automatically, they don’t shift. Combined with the multi-timeframe confirmation and pivot-spread logic, this two-step approach eliminates needless entries.
Take your trading to the next level with this indicator
💻 System Requirements
Item Details Platform MetaTrader 4 (MT4) Timeframes All
| Item | Details |
|---|---|
| Platform | MetaTrader 4 (MT4) |
| Timeframes | All |
📦 Product Contents
・MTF_Pibo_Version_EV (main indicator file)
⚙️ Installation Steps
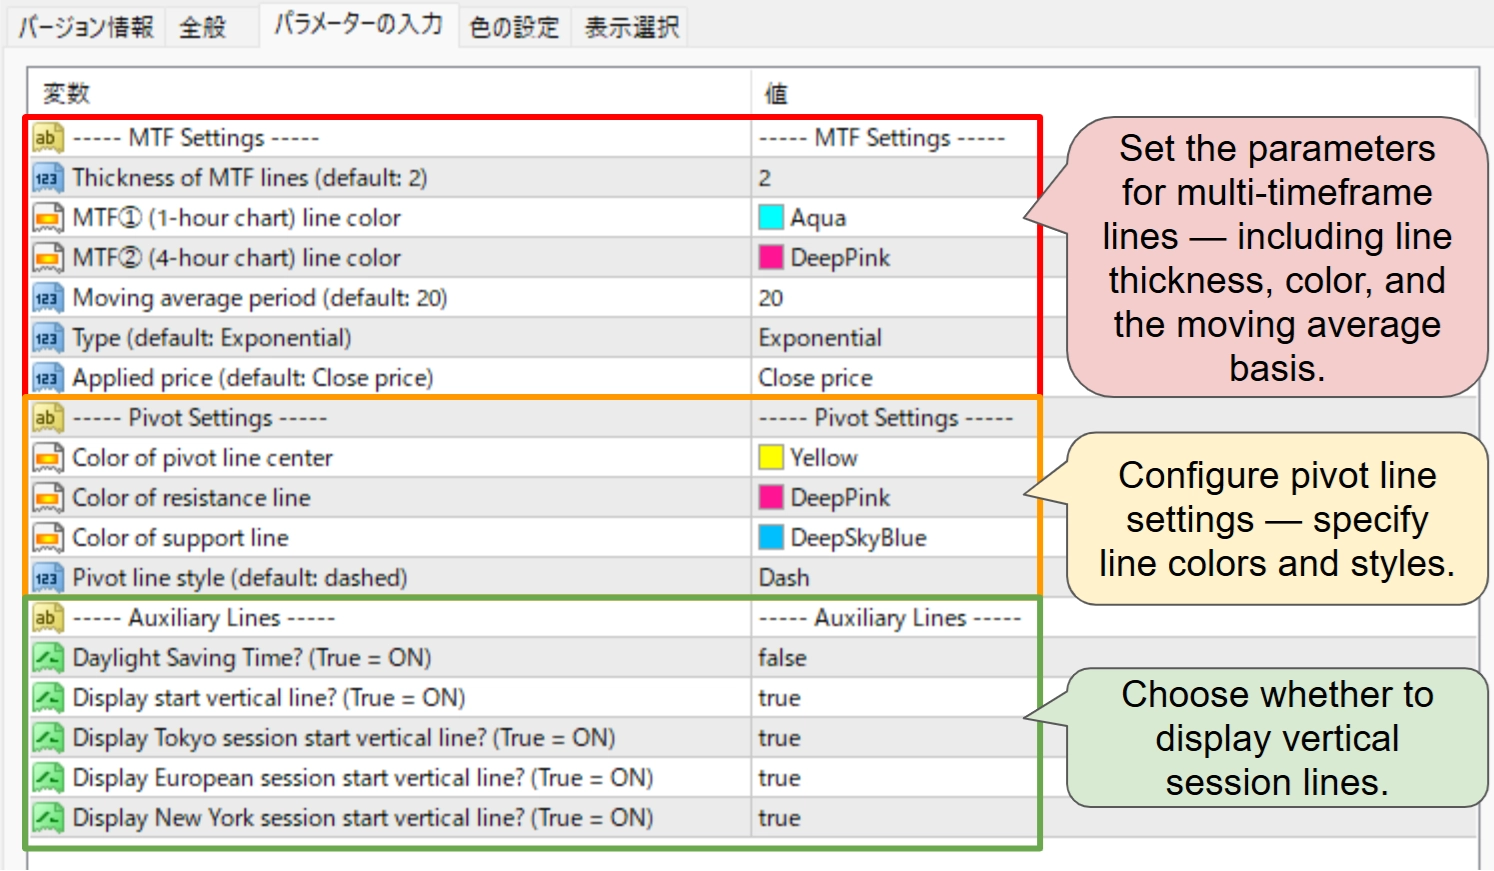
The indicator settings are divided into three blocks:
・MTF — configure line thickness, colors, and moving average period (cannot be hidden). ・Pivot lines — set colors and styles (cannot be hidden). ・Session start lines — display vertical lines at each market start time (set to false to hide). Note: Standard time and daylight-saving time shift these lines by one hour.■ With the version upgrade, an alert function has been added.
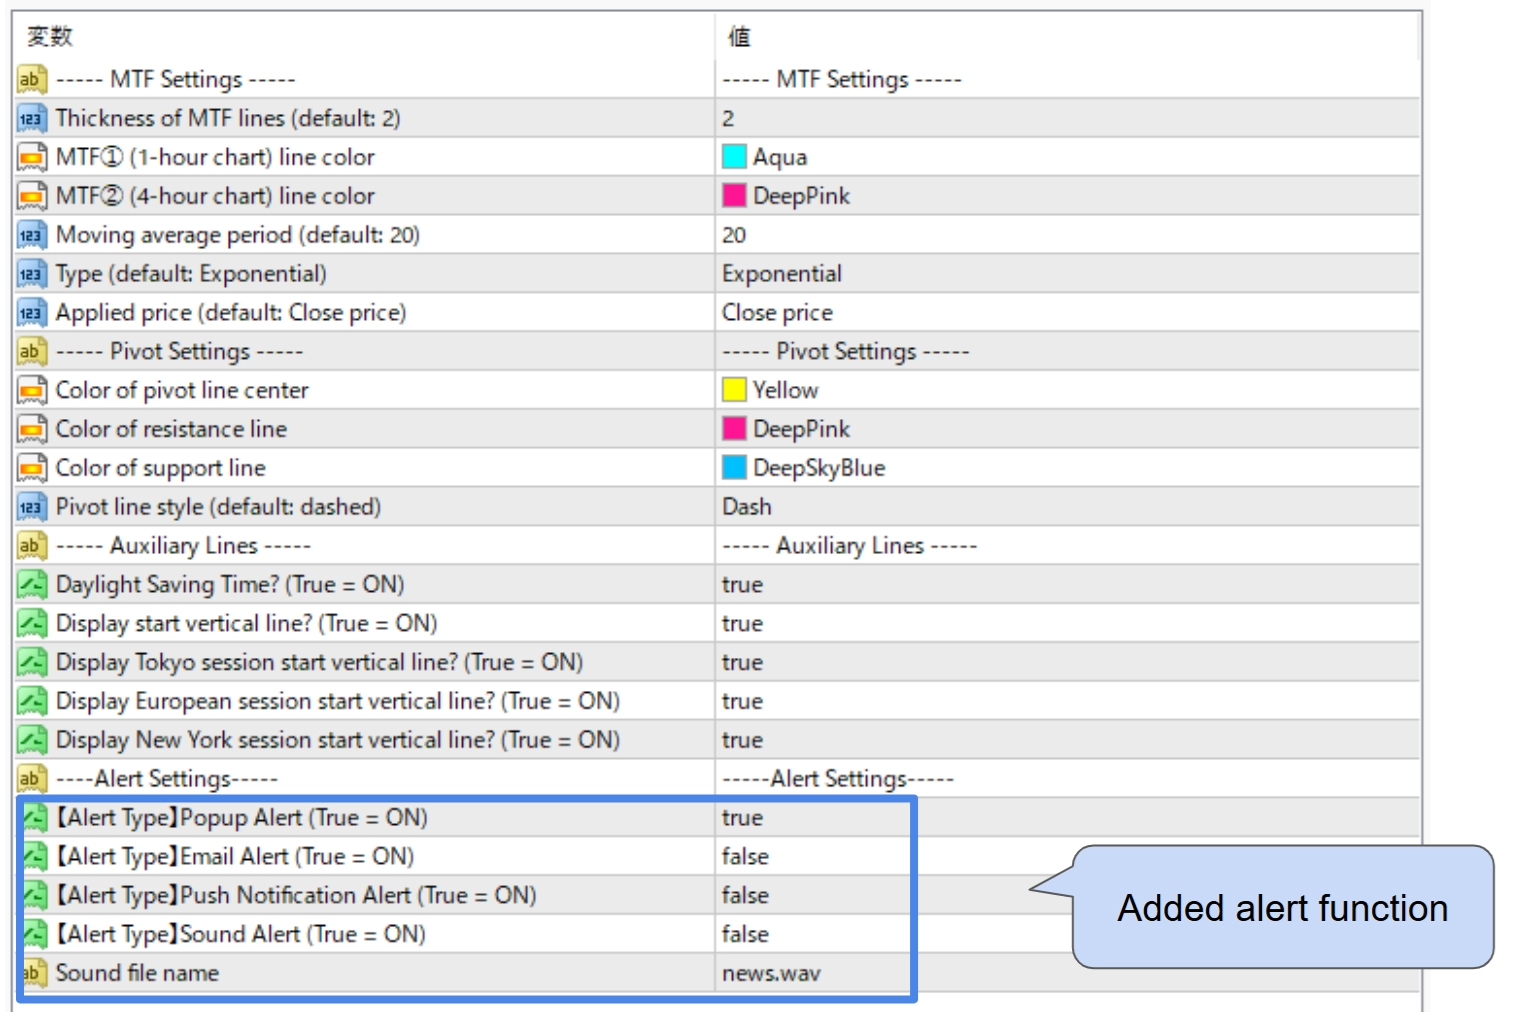
An alert will now be triggered when the price crosses each of the following lines: PP, R1/S1, R2/S2, and R3/S3. ※ Available alert types: Popup, Email, Push notification, and Sound. ※ Multiple alerts can be enabled simultaneously. (Available combinations: ① Popup + Email alert, or ② Popup + Push notification alert) ※ Available from version 1.03 and later (the latest version will be downloaded automatically).
⚠️ Disclaimer
Use at your own risk. We accept no liability for any trading losses resulting from the use of this signal tool (indicator). Entry at a pivot bounce does not guarantee profit. Images are for illustrative purposes only. Only the .ex4 file is sold.
Free trial (again) [MT4] Trial: Auto-Drawing Pivot Lines Indicator https://www.gogojungle.co.jp/tools/indicators/71680 ↑If the trial displays correctly for you, this full tool will also work. We recommend trying the trial first for peace of mind.
📅 Update History
・(November 8, 2025)Program updates: versions 1.02 and 1.03 (added alert function) ※ Version 1.03 is the latest.・(Nov 3, 2025) Program update 1.01 — corrected an error in the PP display calculation. ・(Nov 2, 2025) Initial release 1.00.
GogoJungleを初めてご利用する方へ商品のご利用まではかんたん3ステップ!
GogoJungleでは、会員様向けに、あなたの投資生活を豊かにするサービスをご用意しております。また、商品をご購入いただけるのは、会員様のみとなっております。今すぐ会員登録をして、GogoJungleを活用してみませんか!