
Product outline
Community(0)
triangle_strain
実値と理論値の歪みを可視化する.
Sales Result:
2本
Reviews:
Keywords:
Category:
How to provide:
Indicator
Sales from:
02/15/2024
Last Updated:
-
Version:
-
Available company:
Payment method:


¥1,000(taxed)
Provider/Distributor
Sales site
GogoJungle

-- 市場の歪みを可視化する --
USD,EUR,JPY の三つ巴における,実値と理論値の差を可視化するインジケータです.
EURUSDのチャートにセットした場合,
EURUSD理論値(=EURJPY/USDJPY) がメインチャートに表示されます.
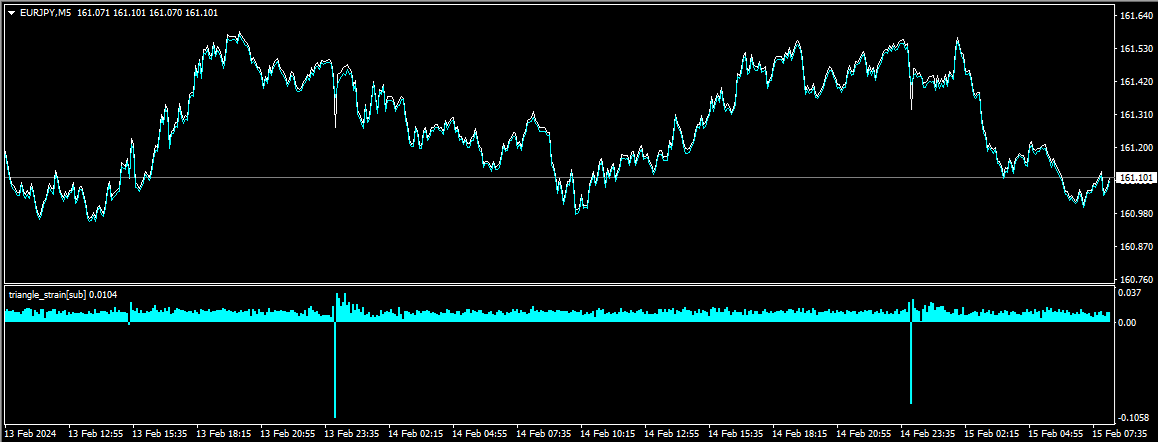
サブチャートには,実値と理論値の差がヒストグラムで表されます.
市場は一般的に合理的な価格形成を行うため,基本的に実値と理論値はシンクロして動きますが,時に歪みが生じることがあります.
しかし市場は常に合理的であろうとするため,歪みはいずれ修正されます.
この現象を利用して,歪み分だけ鞘抜きを行う取引手法が存在します.
本インジはEURUSD,EURJPY,USDJPYの3通貨のみ適用できます.
表示方法の変更,通貨拡張等のカスタムは有料で承ります.
お気軽にご相談ください.
-- 参考画像 --
EURJPY M5 (歪みは短期的なものなのでスケールは小さい方が好ましいです)
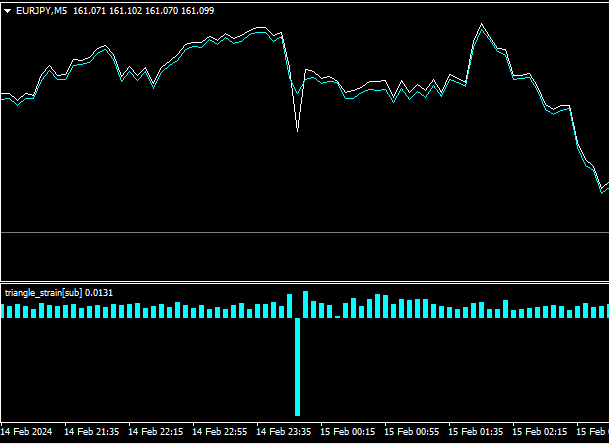
1枚目の拡大図
¥1,000(Tax included)
Product outline
Community(0)
Best Seller Ranking
Recommended Products (Campaigns)
For those using GogoJungle for the first timeEasy 3 steps to use the product!
At GogoJungle, we provide services to enrich your investment life for our members. In addition, product purchases are limited to members. Why not register as a member now and make use of GogoJungle!
01
Enter user information and register as a member
02
Follow the instructions to make a purchase
03
Download from My Page