[東大式] ドル円「ローソク足パターン」
![[東大式] ドル円「ローソク足パターン」 Auto Trading](https://cdn.gogojungle.co.jp/img/products/30713/medium)
- Whole period
- 2 years
- 1 year
- 6 months
- 3 months
- 1 month
Forward testing (Profit)
Monthly Statistics
- Jan
- Feb
- Mar
- Apr
- May
- Jun
- Jul
- Aug
- Sep
- Oct
- Nov
- Dec
Calendar for Months
About EA's Strategy
Translating...
Protect your property. It's an EA that will not lose in the long run. Steadily Build " Build "wealth". |
Table of Contents
- EA's original concept (1): Buy at the push of a button.
- EA's original concept (2): Chart patterns of candlesticks
< < Only two key concepts behind this EA > >
[Todai-style] Dollar/Yen "Candlestick Patterns"
Thank you for visiting the
On this page you will find Concepts behind EA Starting with the
Entry/Exit Logic The logic of the entry/exit is as follows.
Showing that it works Statistical and numerical evidence
We publish "everything" to the extent possible, up to
Please take a look at just what you are interested in.
Quickly, this EA.
Concept 1: The concept of "push-buy
Concept 2 : Chart Patterns of Candlesticks Concept 2 : Chart Patterns of Candlesticks
It was created with two ideas in mind.
Each of these will be explained.
Concept 1: Capturing the "essence of the market".
The concept of "push-buy" is an investment concept called
A pushback (or a return) is a
After the price renews a high (low) in a trend
After a new high (low)
When a push (return high) is formed, the
It is an investment technique that involves buying (selling).
No matter how strong the upward trend is, prices do not continue to rise unilaterally, but
rise while forming pushes at various points.
This is the "essence of the market " and will not change over the years.
Therefore, by using this as a base
We thought we could create an EA that would continue to function over a long period of time with no expiration date can be created that will continue to function over a long period of time with no expiration date.
Concept #2: Candlesticks form
describing "price movement quirks."
Chart Pattern" type methods
A candlestick pattern (or chart pattern) is
In other words, it is a trading strategy that trades based on
A candlestick pattern (or chart pattern) is a trading strategy in which trades are made based on the "shape of the price movements formed by the chart.
(Scalping traders, who repeat many trades in a short period of time, and day traders, who make huge profits from day trading, are very likely to focus on these chart price movements. (Many people may imagine a so-called "trader" as someone who makes a series of such short-term trades while monitoring several screens at the same time.)
Advantages of Candlestick Patterns: * Candlestick Patterns
So-called "fitting" or
Curve fitting" almost never happens.
When developing investment strategies for automated trading, historical data is used for verification.
One major disadvantage of this is that "guesswork," "over-optimization," and "curve fitting"
can occur unintentionally.
In other words, it means that rules are created that conveniently work only on past data.
This means that they create rules that work for their own convenience only on past data.
(The reason for this is the existence of "numerical parameters". For example, consider an investment rule that says, "If the current closing price is greater than the closing price X days ago, buy and enter. If the value of parameter X ranges from 2 to 100, it is easy to imagine that any one of those Xs will do very well in the historical data.)
However, in chart pattern-based strategies
price movements are described directly as a programming language, so there are no
There are no such "parameters.
In other words.
It is extremely unlikely that "fitting " to historical data will occur.
This is the case.
* [Todai-style] Dollar/Yen "Candlestick Patterns
Background to the development of the
In creating this EA
We focused exclusively on the "dollar-yen" currency pair.
We analyzed an enormous amount of data in the charts for the period from 2016 to 2019.
Then, we found that In the 1-hour time frame
I have found that after certain price movements
a pattern of "push" and "return high" price movements emerge The EA was created to create a new EA.
At first, we thought that this might be a feature that was only seen during this period
But when we examined the data from 2010 to 2021, we found that the same pattern of price movements had formed.
However, when we examined the data for the period from 2010 to 2021, we found that the pattern of price movements was
The results are spectacular.We discovered that the same price movement patterns were forming The same pattern of price movement was found to be forming.
* Disadvantages of Candlestick Patterns.
"A period of inactivity The possibility of a "non-functional period
On the other hand, there are some disadvantages. Since the price movement characteristics of candlesticks are described, there is a possibility that these price movement characteristics may not appear in a particular period of time.
There is a possibility that these price movement characteristics may not appear in a particular period of time.
A candlestick pattern that performed very well for a period of time
After a certain period of time, it may not work at all.
Then, after a few years, the performance may return.
<About the product
Explanation of the trap (entry) rule
All of the traps are described above.
Candlestick patterns are seen after the formation of a "push" and a "return high" and capture large price movements.
This is done by
24 hours a day, any time of the day.
Entry is made when this pattern appears.

The picture on the left shows a trade that occurred on May 12, 2022.
First, the EA identifies a downtrend.
Then, the formation of a return high is confirmed.
While there are a great many of these situations, the
The photo on the left is'Big price move after the formation of a return high.'is likely to occur, the
To a specific pattern.apply toThe EA determined thattherefore
Sell Entry."
Then, after 12 hours, the market dropped significantly and reached TP, so
Profit taking took place.
In this way, we can capture large trend markets.
Explanation of Exit Rules
[ Regarding SL ]
Two stop-loss rules are available, the one closer to the current price is selected.
- Fixed SL
SL with a fixed pips value.
Recommendation is 50-100 pips. In the default settings and forward test, the SL is 50 in the initial setup and forward test. - Trailing Stop
A trailing stop based on the high and low of the last X candlesticks.
It can be switched ON/OFF.
The trailing stop is set up for those who are concerned about fixed SL only, so it is OFF in the forward test settings. It is set to OFF in the forward test settings. The default setting is also OFF.
[ On TP ]
A fixed value TP can be set.
The recommended value is 80 pips or less. Initial Settings Forward test is set at 100 pips in the forward test.
[ * Regarding do-ten (rollover) * ].
Buy If a sell signal occurs while you are in a buy position, close out your current buy position and take a sell position.
position, the current buy position is closed and a sell position is taken. The reverse is also true.
We have tested this over the past 12 years.
Exits with do-ten are superior and much more profitable than those without do-ten
results.
The image below shows the chart as of May 20, 2022.
Not only in trending markets
Range market In a range market, the settlement by do-ten is also a good way to determine the timing of the market and to confirm profits and make an entry in the opposite direction.
profit and make an entry in the opposite direction.
It is not only in trending markets.

Backtest Results
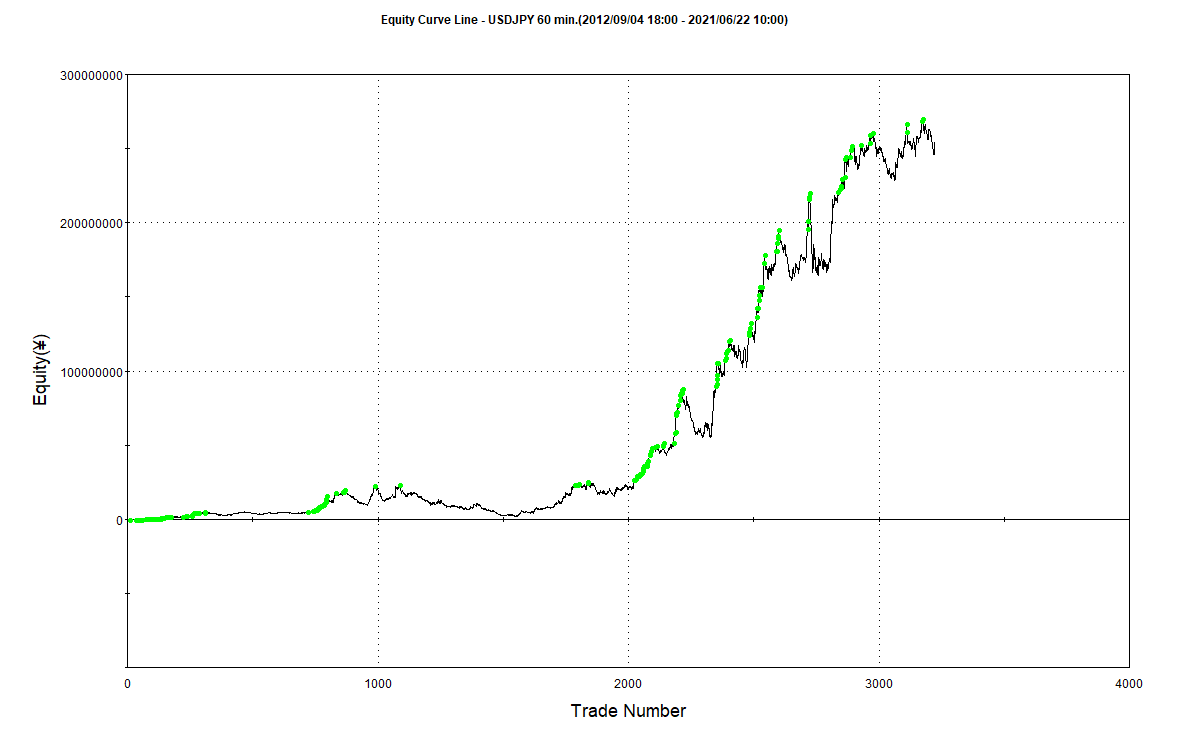
1Lot (simple interest) operation yields 8 million yen profit in 10 years.

The above is the result of continuous operation at a simple interest rate of 1 lot (100,000 currency ).
- Annual profit : 800,000 yen
- Trade frequency: Average 1 trade/day
The drawdown occurred in September 2015 - September 2016.
This is a result more reflective of reality. It is possible to adjust the parameters to make it look as if such drawdowns did not occur at all, but that would be a completely meaningless action, so we dare not do so.
These are the results of a "forward test" and not the results of a "fit" to historical data.
The spread is assumed to be 1 pips, but due to the timeframe, the spread has little effect.
By taking a risk of 2% with money management (compound interest), you can make 1 million yen → approx. 30 million yen.
The above is the result of always trading at 100,000 currency when the "simple interest" method is used.
However, when we invest in the actual account, we will be using "compound interest".
Let's take a look at the results in that case.
As an example, let us assume that the initial capital is 1 million yen and that the risk is 2% of the account capital for each trade.

Looking at the results, the initial fund of 1 million yen has grown to approximately 30 million yen in 10 years and the asset has increased 30 times.
Since the profit was about 8 million yen in 10 years when the interest rate was simple, you can understand the greatness of compound interest investment.
(* This is a result of simulation and does not guarantee future profits.)
Also, an initial capital of 1 million yen and a risk of 2% for each trade is a very realistic figure.
Compound interest and simple interest make little difference in performance over a period of a few months, but over a longer period of time, such as 10 years, the difference can be quite noticeable.
However, over a longer period of time, such as 10 years, the difference is more pronounced.
1 million yen → ¥250 million by simply increasing risk from 2% to 5%.
Finally, let's look at the results when the risk of each trade is reduced from 2% to 5%.
(* These are simulation results and do not promise future profits.)
If we increase the risk to 5%, the initial capital of 1 million yen becomes 250 million yen in 10 years.
Since MT4 could not hold more than 10 lots of potions, we used other simulation applications for the calculation.
And of course, the more risk you increase, the bigger the drawdown.
In reality, not many people can mentally endure such large drawdowns.
In reality, few people would be able to mentally endure such a large drawdown.
However, if you can withstand such drawdowns, it goes without saying that compounding is effective.
Risk and bankruptcy probability
Investing involves risk.
So what is the "risk" when considering automated trading with EAs?
In my opinion.
It isHow likely are you to go broke?"the so-calledProbability of bankruptcy."We believe that this is the case.
The definition of bankruptcy may vary from person to person.
One person might say "it's bankruptcy" when one million in funds is reduced to 100,000, while another might consider it bankruptcy when one million in funds is reduced to 500,000.
In any case, it is extremely important to know the bankruptcy probability of the EA you use.
For example, if someone says, "There is a 60% chance that your account balance will go from 1 million yen to 500,000 within a year," no one will use that EA.
In the following, we define "bankruptcy" as
"assets are reduced to 1/2 of their original value within 2 years (e.g., if the initial capital is 500,000, it is reduced to 250,000)."
On this basis [Todai-style] Dollar-Yen "Candlestick Patterns" Then
How much of your account balance would be at risk if you risked What is the probability of bankruptcy? In
was calculated by having a computer perform more than 5 million calculations to simulate the portfolio asset transition.

Left is the result.
0% probability of bankruptcy for all risk ratios below 6%.and
At 10% risk, the bankruptcy rate is 6%.
At 15% risk, the probability of bankruptcy is 18%, a high level.
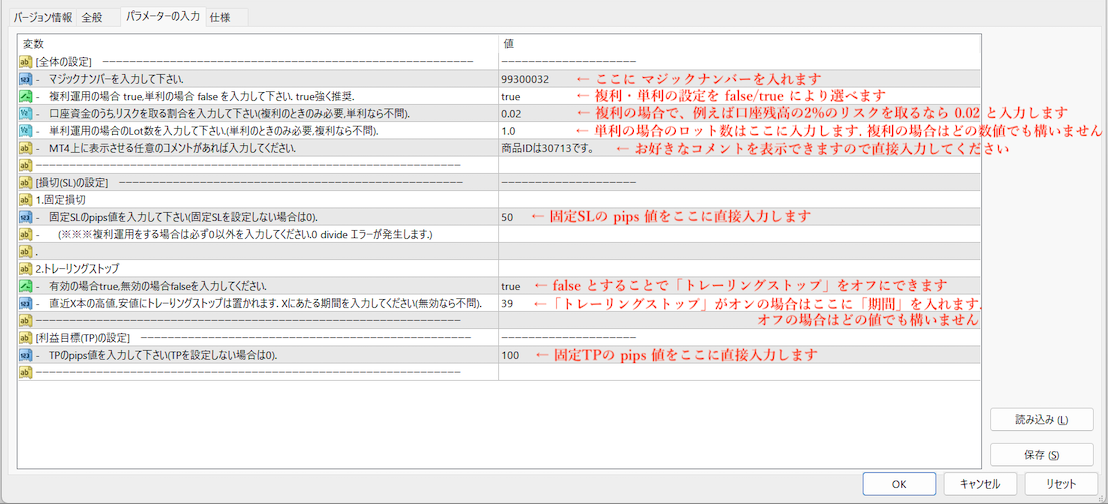
Setup Method
When the EA is applied to the MT4 chart, the following setting screen will appear.
As shown in the image, the explanation is written in the left column.Enter the value you want to set directly in the right column The following is a list of the settings
(If the image is too small to view, please enlarge it)

Also, on the chart of MT4
Comment appears on the MT4 chart as shown in the image on the left.
* Current positon is "Buy Positon", "Sell Position", "No Position".
The following is a list of the most common types of data.
You can check the ticket number of the most recent position.
Even if you are operating with multiple EAs
You can see which position is the most recent one by this EA.
The "optional comments" of the purchaser can be displayed.
[Regarding installation]
In addition to the EA file, we request that you install the Libraries file. The locations are as follows
- EA files ... Please place it in \MetaQuotes\Terminal\Experts
- Libraries file ... Please place it in \MetaQuotes\Terminal\Libraries
How to calculate the number of lots (for compound interest)
- account balance
- Risk Percentage (see image on how to set up)
- Fixed SL pips value
The calculation is based on three factors
For example, if the account balance is 1 million yen, the risk ratio is 2%, and the fixed SL is 50 pips
For each trade, 2% (= 20,000 yen) of the 1,000,000 yen account balance is risked.
The maximum loss per trade is -50 pips of the fixed SL value.
If you have a 1 lot position, the amount of money you will lose for -50 pips is 50,000 yen (* 1 lot = 100,000 currency).
The number of positions is
20,000 yen / 50,000 yen = 0.40 (Lot).
<Statistical evidence that this EA works x 3 >
Below we present some statistical evidence.
While we cannot present all of them.
We are not able to present everything, but we have limited our results to what is relatively easy to understand.
It contains some technical content, so please skip it if you are not interested.
1. randomly generated trade results v.s. Dollar/Yen "Candlestick Pattern " comparison (Monkey Test)
The monkey test is a method often used in machine learning and is extremely effective in identifying superiority.
The idea is to have the computer repeat random trades over a specific period of time with minimum matching conditions, such as trade frequency.
We will do this over 10,000 times and compare the 10,000 results obtained with the performance of this EA and the Dollar/Yen "Candlestick Pattern".
For example, if this EA is superior in 9,000 of the 10,000 random results obtained,
this EA is considered to work as an investment strategy.
The superiority of this method is determined by comparing the case in which only the "setup" is randomized, the case in which only the "closing" is randomized, and the case in which both the "setup" and the "closing" are randomized.
Below are the results.

compared to random results.Overall, the dollar-yen "candlestick pattern" is excellent.
2. what percentage of the total number of profitable parameter combinations?
There is a numerical parameter in an automated trading program.
If the EA was profitable only for a certain value of this parameter, this can be said to be a mere guess.
However, if you try 100 different values of this parameter, and then use
If it were profitable in all of them, it would be sufficiently robust.
We consider this ratio as one indicator to determine the superiority of the EA.
Dollar-Yen "Candlestick Patterns"There were no parameters for entry conditions in the
Two parameters exist for the exit condition.
We tried these two values 20 (streets) × 15 (streets) = 300 (streets), and found that
this (something or someone close to the speaker (including the speaker), or ideas expressed by the speaker)All combinationsEA is profitable in the
Price: $216.14 (taxed)
¥35,000(taxed)
●Payment


Sales from : 07/28/2021 20:59
Price: $216.14 (taxed)
¥35,000(taxed)
●Payment
Just like discretionary trading, there are those that decide trading and settlement timings by combining indicators, those that repeatedly buy or sell at certain price (pips) intervals, and trading methods that utilize market anomalies or temporal features. The variety is as rich as the methods in discretionary trading.
To categorize simply,
・Scalping (Type where trades are completed within a few minutes to a few hours),
・Day Trading (Type where trades are completed within several hours to about a day),
・Swing Trading (Type where trades are conducted over a relatively long period of about 1 day to 1 week)
・Grid/Martingale Trading (Holding multiple positions at equal or unequal intervals and settling all once a profit is made. Those that gradually increase the lot number are called Martingale.)
・Anomaly EA (Mid-price trading, early morning scalping)
However, a substantial advantage of automated trading is its ability to limit and predict risks beforehand.
[Risk]
Inherent to forex trading are the trading risks that undeniably exist in automated trading as well.
・Lot Size Risk
Increasing the lot size forcibly due to a high winning rate can, in rare instances, depending on the EA, lead to substantial Pips loss when a loss occurs. It is crucial to verify the SL Pips and the number of positions held before operating with an appropriate lot.
・Rapid Market Fluctuation Risk
There are instances where market prices fluctuate rapidly due to index announcements or unforeseen news. System trading does not account for such unpredictable market movements, rendering it incapable of making decisions on whether to settle in advance or abstain from trading. As a countermeasure, utilizing tools that halt the EA based on indicator announcements or the VIX (fear index) is also possible.
[Benefits]
・Operates 24 hours a day
If there is an opportunity, system trading will execute trades on your behalf consistently. It proves to be an extremely convenient tool for those unable to allocate time to trading.
・Trades dispassionately without being swayed by emotions
There is an absence of self-serving rule modifications, a common human tendency, such as increasing the lot size after consecutive losses in discretionary trading or, conversely, hastily securing profits with minimal gains.
・Accessible for beginners
To engage in Forex trading, there is no prerequisite to study; anyone using system trading will achieve the same results.
[Disadvantages]
・Cannot increase trading frequency at will
Since system trading operates based on pre-programmed conditions, depending on the type of EA, it might only execute trades a few times a month.
・Suitability may vary with market conditions
Depending on the trading type of the EA, there are periods more suited to trend trading and periods more suited to contrarian trading, making consistent results across all periods unlikely. While the previous year might have yielded good results, this year's performance might not be as promising, necessitating some level of discretion in determining whether it is an opportune time to operate.
・MT4 (MetaTrader 4. An account needs to be opened with a Forex company that offers MT4.)
・EA (A program for automated trading)
・The operating deposit required to run the EA
・A PC that can run 24 hours or a VPS (Virtual Private Server), where a virtual PC is hosted on a cloud server to run MT4.
Additionally, there are both demo and real accounts available. You can experience trading with virtual money by applying for a demo account. After opening a real account, you select the connection server assigned by the Forex broker, enter the password, and log in to the account.
When you deposit money into your account using the method specified by the forex broker, the funds will be reflected in your MT4 account, and you can trade.
Firstly, download the purchased EA file from your My Page on GogoJungle. You will download a zip (compressed) file, so right-click to extract it and retrieve the file named ‘◯◯◯ (EA name)_A19GAw09 (any 8 alphanumeric characters).ex4’ from inside.
Next, launch MT4 and navigate to ‘File’ → ‘Open Data Folder’ → ‘MQL4’ → ‘Experts’ folder, and place the ex4 file inside. Once done, close MT4 and restart it. Then, go to the upper menu ‘Tools’ → ‘Options’, and under ‘Expert Advisors’, ensure ‘Allow automated trading’ and ‘Allow DLL imports’ are checked, then press OK to close.
The necessary currency pair and time frame for the correct operation of the EA are specified on the EA sales page. Refer to this information and open the chart of the correct currency pair time frame (e.g., USDJPY5M for a USD/Yen 5-minute chart).
Within the menu navigator, under ‘Expert Advisors’, you will find the EA file name you placed earlier. Click to select it, then drag & drop it directly onto the chart to load the EA. Alternatively, you can double-click the EA name to load it onto the selected chart.
If ‘Authentication Success’ appears in the upper left of the chart, the authentication has been successful. To operate the EA, you need to keep your PC running 24 hours. Therefore, either disable the automatic sleep function or host MT4 on a VPS and operate the EA.
If you want to use it with an account other than the authenticated one, you need to reset the registered account.
To reset the account, close the MT4 where the Web authentication is registered, then go to My Page on GogoJungle > Use > Digital Contents > the relevant EA > press the ‘Reset’ button for the registration number, and the registered account will be released.
When the account is in a reset state, using the EA with another MT4 account will register a new account.
Also, you can reset the account an unlimited number of times.
→ Items to Check When EA is Not Operating
1 lot = 100,000 currency units
0.1 lot = 10,000 currency units
0.01 lot = 1,000 currency units
For USD/JPY, 1 lot would mean holding 100,000 dollars.
The margin required to hold lots is determined by the leverage set by the Forex broker.
If the leverage is 25 times, the margin required to hold 10,000 currency units of USD/JPY would be:
10000*109 (※ at a rate of 109 yen per dollar) ÷ 25 = 43,600 yen.
・Risk-Return Ratio: Total Profit and Loss during the period ÷ Maximum Drawdown
・Maximum Drawdown: The largest unrealized loss during the operation period
・Maximum Position Number: This is the maximum number of positions that the EA can theoretically hold at the same time
・TP (Take Profit): The set profit-taking Pips (or specified amount, etc.) in the EA's settings
・SL (Stop Loss): The set maximum loss pips (or specified amount, etc.) in the EA's settings
・Trailing Stop: Instead of settling at a specified Pips, once a certain profit is made, the settlement SL is raised at a certain interval (towards the profit), maximizing the profit. It is a method of settlement.
・Risk-Reward Ratio (Payoff Ratio): Average Profit ÷ Average Loss
・Hedging: Holding both buy and sell positions simultaneously (Some FX companies also have types where hedging is not allowed)
・MT4 Beginner's Guide
・Understanding System Trading Performance (Forward and Backtesting)
・Choosing Your First EA! Calculating Recommended Margin for EAs
・Comparing MT4 Accounts Based on Spread, Swap, and Execution Speed
・What is Web Authentication?
・Checklist for When Your EA Isn't Working