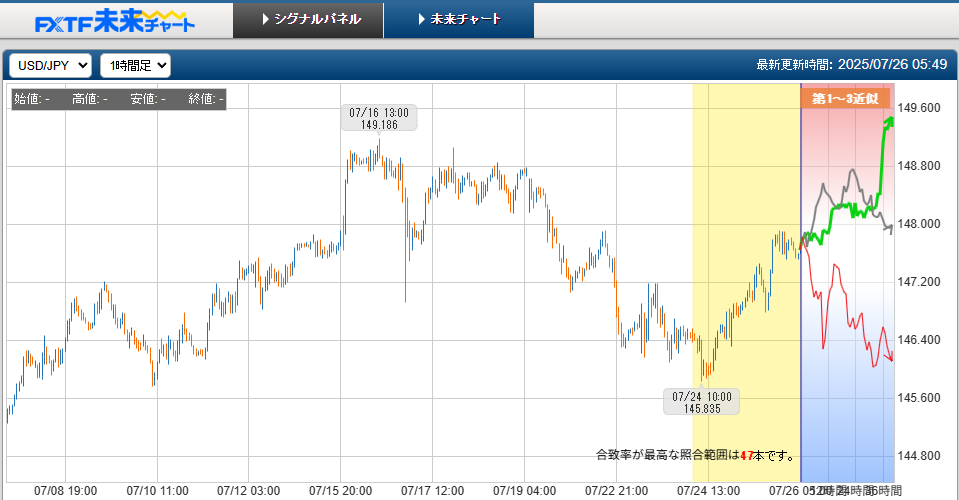
Dollar/Yen 2025/08/04(Mon) Week opening is range
ForecastThe price movement 4 hours from now is most likely to be within the range.Prediction LogicBelow is an analysis and overall judgment based on daily, 4-hour, and 15-minute information.
Supplementary AnalysisElliott WaveForecast: Currently, it is likely in the final stage of a corrective wave (Wave 2 or Wave 4).
Logic:
Logic:
Logic:
ConclusionFor USDJPY at the start of the week, the most likely scenario is a range. The daily uptrend coexists with the 4-hour and 15-minute down pressures, while the oversold condition on the 4-hour suggests a rebound, but the volatility is tempered by BB squeezes, limiting large moves.
- Daily Analysis
- The large cycle is considered to tend to persist and rise steadily, indicating a potential long-term uptrend.
- ADX is rising, indicating the trend is strengthening.
- Price is within BB1 sigma and BB2 sigma squeeze is confirmed, implying volatility is decreasing and price is stabilizing.
- RSI at 40.47 is neutral, not overbought.
- 200-day EMA is trending downward, and the current price is below it, showing lingering long-term downward pressure, though it conflicts with the overall rising tendency of the large cycle.
- 4-Hour Analysis
- The large cycle is at the "entry to a downtrend," suggesting the start of a short-term downtrend.
- Standard deviation and ADX are rising, indicating increasing volatility and trend strength.
- Break below BB1 sigma indicates price below the lower band, showing strong downside pressure.
- RSI at 14.20 is extremely low, indicating oversold conditions and potential short-term rebound.
- 200-hour 4-hour EMA is rising and price is above it, suggesting short-term support may be functioning.
- 15-Minute Analysis
- The large cycle is considered to “persist and tend to decline steadily,” signaling potential continuation of a short-term downtrend.
- Standard deviation is rising, increasing volatility.
- Break below BB1 sigma and BB2 sigma squeeze indicate simultaneous downside pressure and volatility decline.
- RSI at 38.23 is slightly near oversold territory.
- 200-minute EMA is declining, and the current price is below it, indicating continued short-term downtrend.
- Overall Judgment
- Daily suggests a long-term uptrend, but being below the 200-day EMA means downward pressure still remains.
- In the 4-hour, at the entrance to a downtrend, RSI is oversold and a rebound is possible.
- In the 15-minute, a stable downtrend continues, with strong near-term downward pressure.
- BB squeezes on the daily and 15-minute imply lower volatility and make large trend changes unlikely in the near term.
- Therefore, with a rebound potential due to oversold conditions on the 4-hour, the downward pressure on the 15-minute, and the stability on the daily, prices are likely to, 4 hours from now, move within a range.
Supplementary AnalysisElliott WaveForecast: Currently, it is likely in the final stage of a corrective wave (Wave 2 or Wave 4).
Logic:
- The daily large cycle "stable rise" suggests the early stages of impulsive waves (Wave 1 or Wave 3) in Elliott Wave Theory.
- The 4-hour "entry to a downtrend" and the 15-minute "stable decline" may represent short-term corrective waves (Wave 2 or Wave 4).
- RSI (14.20) on the 4-hour being oversold indicates a possible end of the corrective wave or a reversal approaching.
- The daily RSI (40.47) being neutral suggests that it is not the end of a major impulse wave, but rather a corrective phase.
Logic:
- A break below BB1 sigma on the 4-hour and oversold RSI imply a potential rebound from a support zone, suggesting a possible double bottom formation.
- BB2 sigma squeeze on the daily and 15-minute indicate decreasing volatility and the possibility of triangle or range patterns forming.
- No clear breakout yet; the pattern formation within a range is considered ongoing.
Logic:
- In Dow Theory, trends are defined by higher highs and higher lows. The daily “stable rise” and rising ADX suggest a potential uptrend driven by higher highs and higher lows, but price below the 200-day EMA hints at long-term downward pressure.
- The 4-hour “entry to a downtrend” and break below BB1 sigma, along with lower lows on the 15-minute, indicate a short-term downtrend.
- However, the 4-hour RSI (14.20) being oversold implies a possible short-term rebound, leaving some uncertainty about trend continuation.
ConclusionFor USDJPY at the start of the week, the most likely scenario is a range. The daily uptrend coexists with the 4-hour and 15-minute down pressures, while the oversold condition on the 4-hour suggests a rebound, but the volatility is tempered by BB squeezes, limiting large moves.
- Elliott Wave: It is likely positioned toward the end of a corrective wave.
- Chart Patterns: A double bottom or triangle formation is in progress.
- Dow Theory: Short-term downtrend persists, but a rebound is possible.
× ![]()