Dollar-yen on 2025/07/28 (Mon)
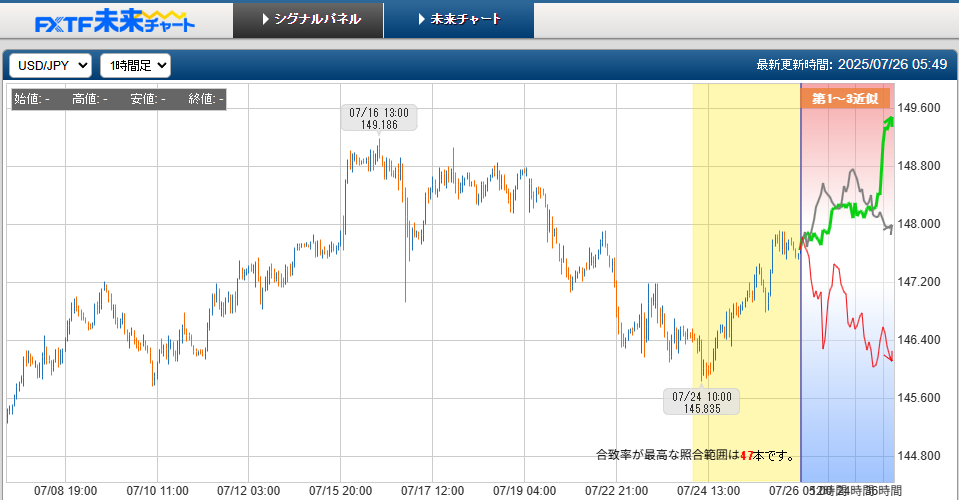
Prediction result: Range likely.
Prediction logic
■ Daily chart analysis
Long cycle: It becomes "1," suggesting a lasting, stable uptrend.
Indicators:
Rising standard deviation and ADX
Break above BB1 sigma
RSI=72.72 (slightly high but within overbought territory)
Rising 200-day EMA and current price above it indicate a prolonged uptrend continues.
Note: RSI has surpassed 70, indicating a slight overheating.
■ 4-hour chart analysis
Long cycle: "6" marks the entry into a rising market.
Indicators:
Rising standard deviation and ADX
Break above BB1 sigma
RSI=68.11
Rising 200-hour EMA and price above it suggest mid-term upward momentum is strong.
Note: RSI is near 70, overheating is approaching.
■ 15-minute chart analysis
Long cycle: "2" suggests the end of an uptrend phase.
Indicators:
BB2 sigma squeeze (decreasing volatility)
RSI=65.36 is not yet in overbought territory, but short-term momentum may weaken.
ADX rising indicates trend strength, but long cycle "2" suggests a pullback or range.
■■ Overall assessment
Daily and 4-hour charts show a clear uptrend, but 15-minute chart long cycle "2" and BB2 sigma squeeze indicate potential short-term consolidation or sideways movement. Since RSI is high across all timeframes (especially above 70 on the daily), it is judged that in the short term, upward momentum may pause and a range (sideways) is likely in about four hours. A sharp decline is unlikely given the bullish signals on the daily and 4-hour charts, though upward momentum may weaken in the short term.
■■ Supplementary analysis
■ Elliott Wave
Analysis: From the daily long cycle "1" and the 4-hour long cycle "6," USD/JPY is likely in the early stages of the impulsive wave (upward wave) of either the third or fifth wave. The 15-minute long cycle "2" suggests a short-term corrective wave (potentially the fourth wave). Therefore, currently a short-term correction phase (fourth wave) within a larger uptrend is possible.
Conclusion: In Elliott Wave terms, likely near the end of Wave 3 or in a Wave 4 correction.
■ Chart patterns
Analysis: Break above BB1 sigma on daily and 4-hour charts with rising ADX indicate a trend-following "breakout" pattern. Meanwhile, 15-minute BB2 sigma squeeze implies decreasing volatility, suggesting possible formation of a range or triangle consolidation. This squeeze may foreshadow a forthcoming significant price move (breakout), but a near-term forecast in four hours suggests staying within a range is more likely.
Conclusion: Short-term chart patterns are likely a triangle consolidation or range formation.
■ Dow Theory
Analysis: Based on Dow Theory, the daily and 4-hour charts show higher highs and higher lows, indicating a clear uptrend (price above the 200 EMA, trend strong). However, the 15-minute long cycle "2" and BB2 sigma squeeze suggest short-term momentum for new highs is weakening, indicating a temporary pause (correction) in the trend. Dow Theory requires a clear lower high and lower low for a trend reversal, which are not present at this time.
Conclusion: According to Dow Theory, the uptrend is continuing, but a short-term consolidation (range) is likely.
■■ Summary
Price action in 4 hours: Range likely.
Logic: With bullish trends on the daily and 4-hour charts, the corrective signals on the 15-minute chart (long cycle "2", BB2 sigma squeeze) and RSI overheating indicate a short-term pause in gains.
Elliott Wave: Wave 3 ending or Wave 4 correction in progress.
Chart pattern: Triangle consolidation or range formation.
Dow Theory: Uptrend continuing, but short-term consolidation possible.
× ![]()