

Utilization of the "Visualization Indicator" (Part 176)
Use of “Visualization Indicator” (part176)
1. Further evolve the “28 Currency Pairs List Indicator” into an indicator
“8CP Visualization Indicator”to plotGBPAUD
The “8CP Visualization Indicator” includesOceania version,London version,NewYork version,AnyCP version. This time, we used theOceania version.
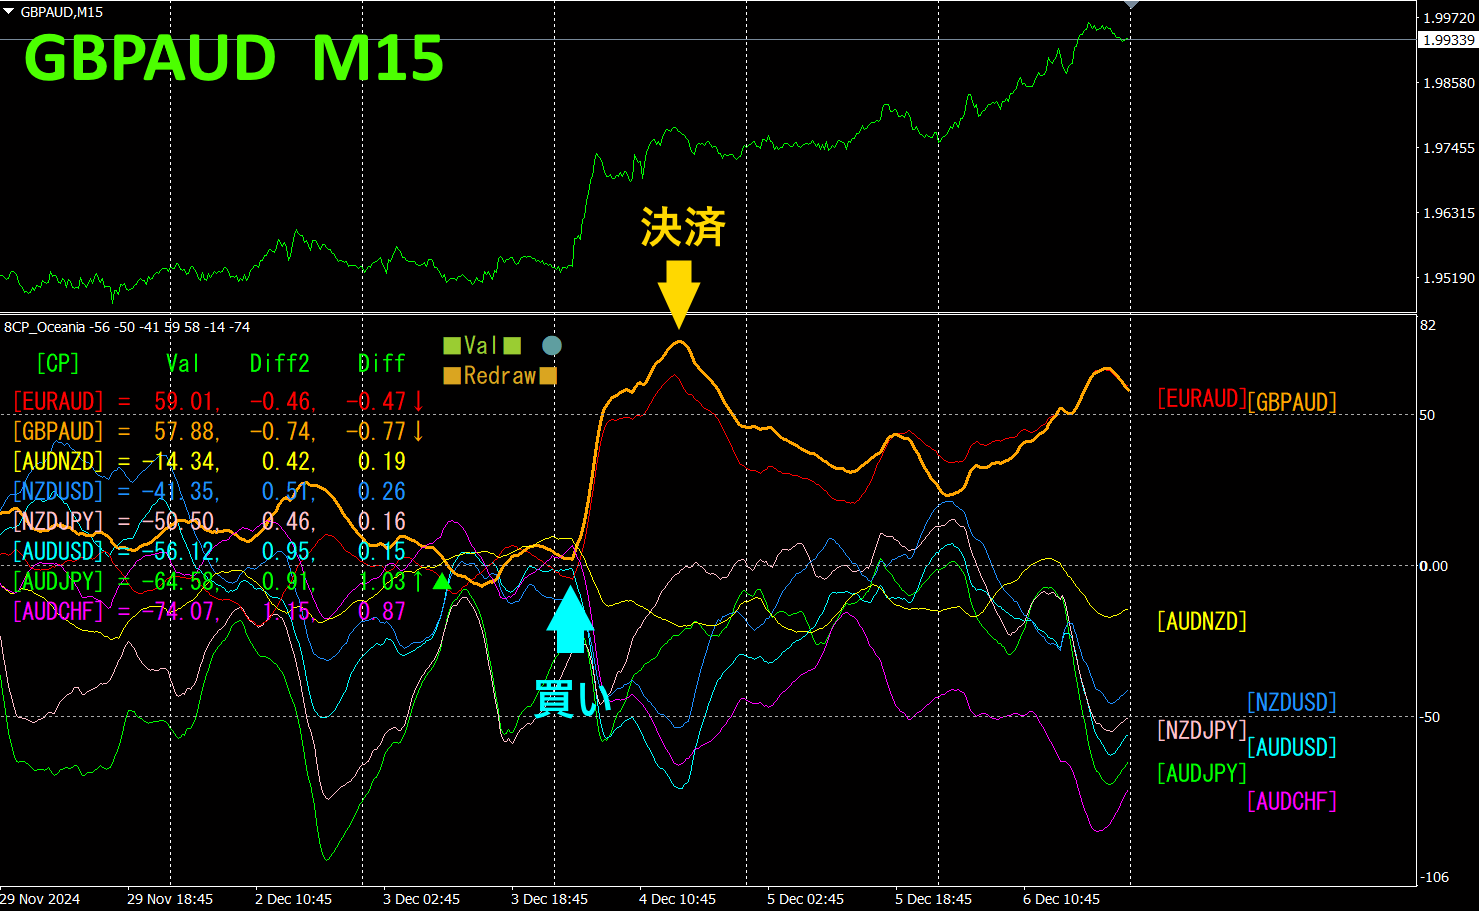
The top half is theGBPAUD 15-minute chart. The bottom half is from the “8CP Visualization Indicator”; the orange thick line graph corresponds toGBPAUD.
With the indicator, you buy when GBPAUD breaks upward from a series of graphs, and you close the position when it reverses at the peak of the mountain. On Wednesday alone, day trading yielded about230pips in profit.
If you use “TrendLine-EX, you can automate entries and exits by diagonal trendline breaks. Leaving it as is enables easy trading. “TrendLine-EX is a semi-automatic EA that can auto-sell on a trendline break downward and auto-close on an upward breakout.
2. Best Select Try the indicator
The figure below shows2024 year12 month04 day11:41 (JST) screenshot.
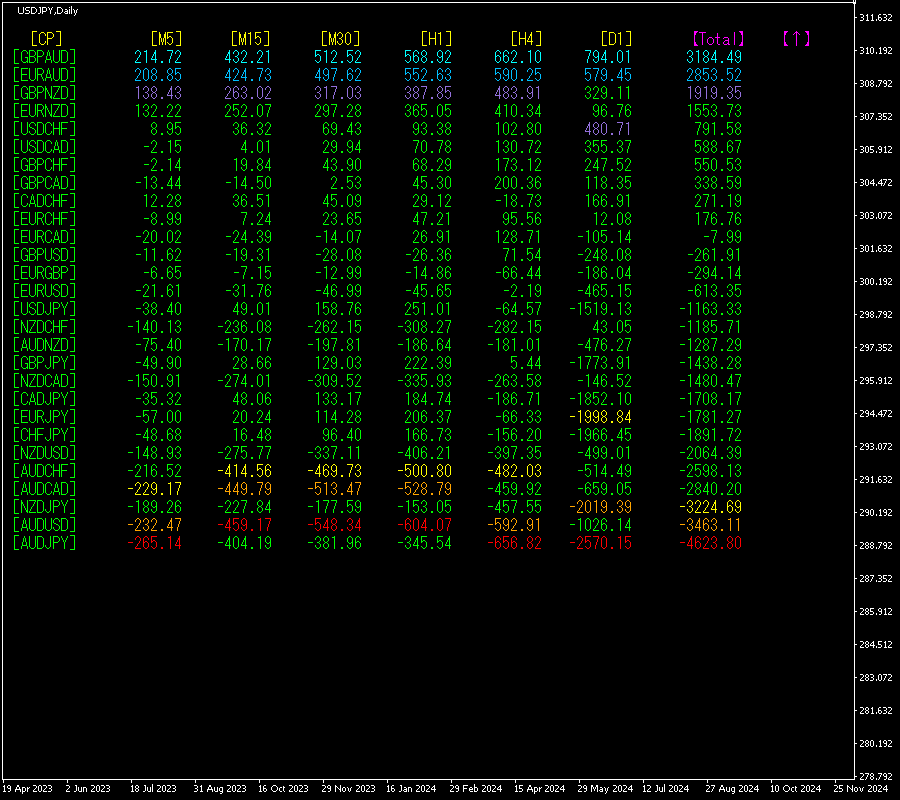
[Total] The numbers are sorted in descending order. At the very top,GBPAUD is blue across all timeframes. value is3184.49, a large positive number. This suggests a strong uptrend in GBPAUD. shows a significant uptrend.
Now, let’s look at the GBPAUD chart.
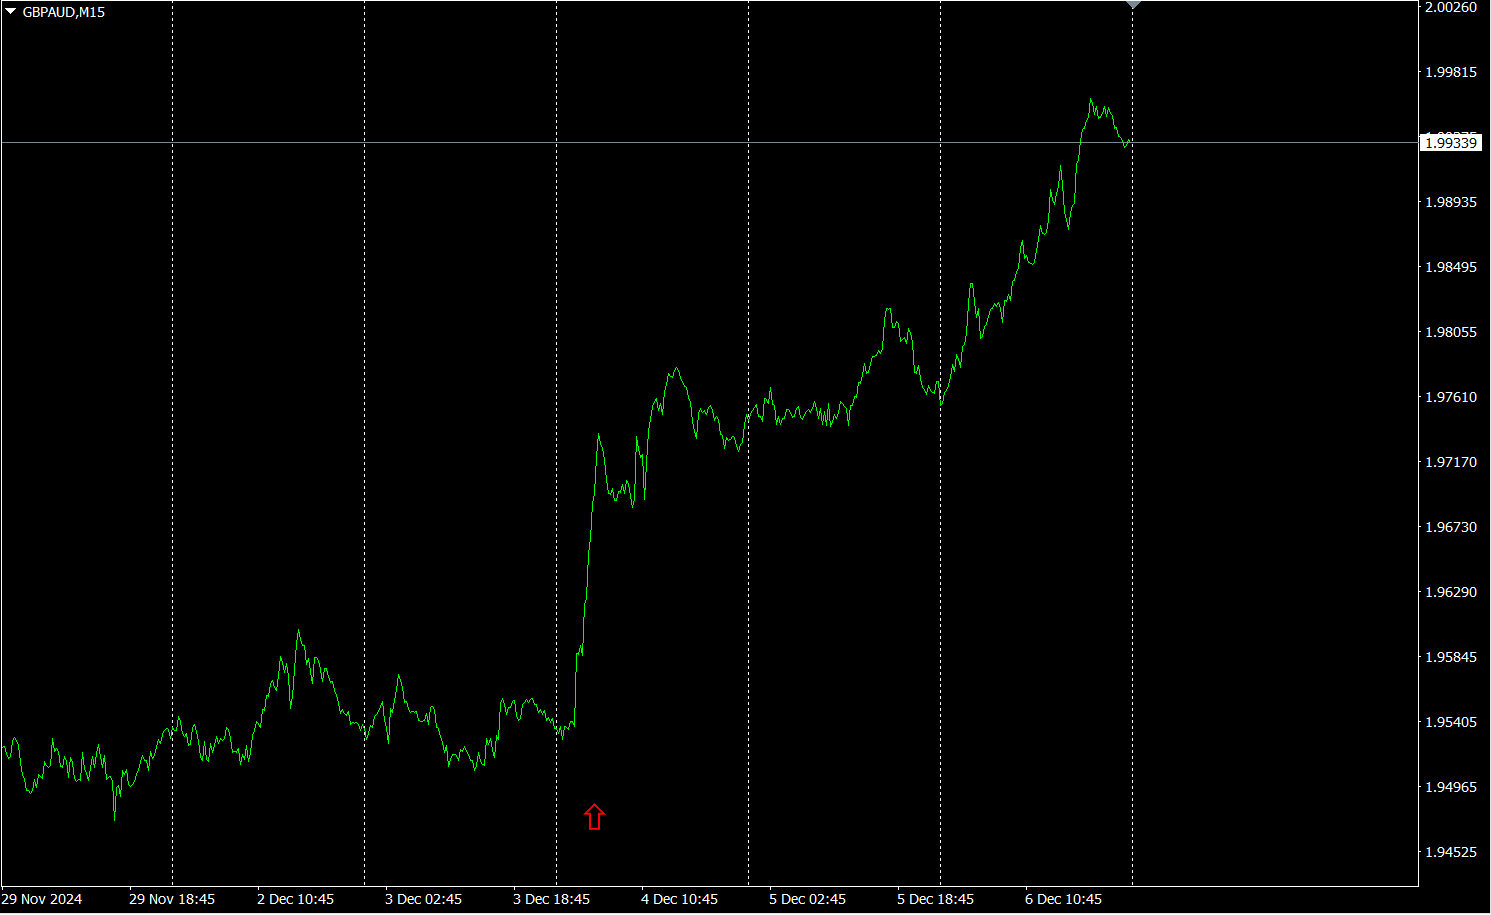
The red arrow marks the captured screenshot. It captures a sharp rise in the uptrend.
“28 currency pairs Best Select indicator can easily identify which currency among 28 pairs is showing the most pronounced trend. It also tells you now whether you should trade, using numbers and colors. It’s a superb indicator for judging all currency pair movements at a glance.
“28 currency pairs Best Select indicator”

https://www.gogojungle.co.jp/tools/indicators/35128
3. 2021 year5 monthto continue tracking movement
2021 year5 month since has been tracked.
To view the overall trend, we draw about30 minutes of the most recent3 weeks on the chart.
Last time, I wrote as follows.
Currently, the strongest currency isJPY, and the trend ofJPY>EUR remains unchanged. The arrows point higher forJPY than forEUR. Therefore, going forward, theEURJPY downside trend is expected to continue.
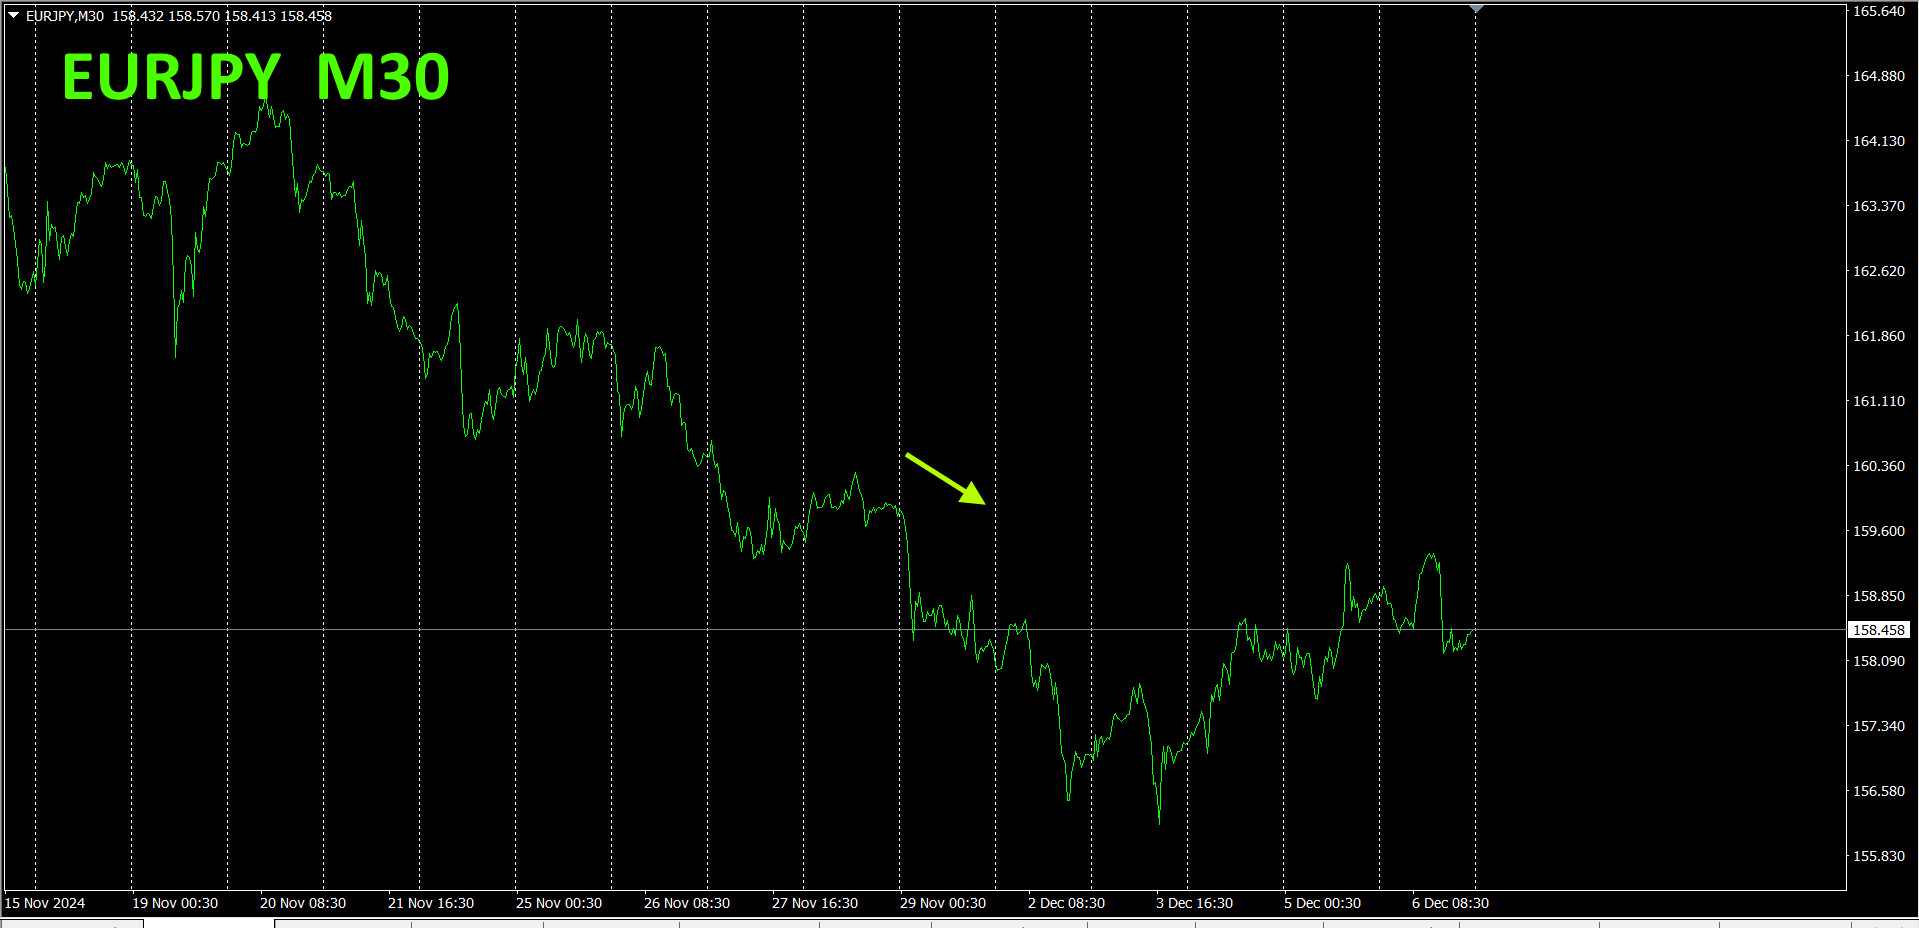
As expected, Monday and Tuesday saw declines. Afterwards, it appears to have formed a bottom and moved in a range.
30 minutes currency strength chart.
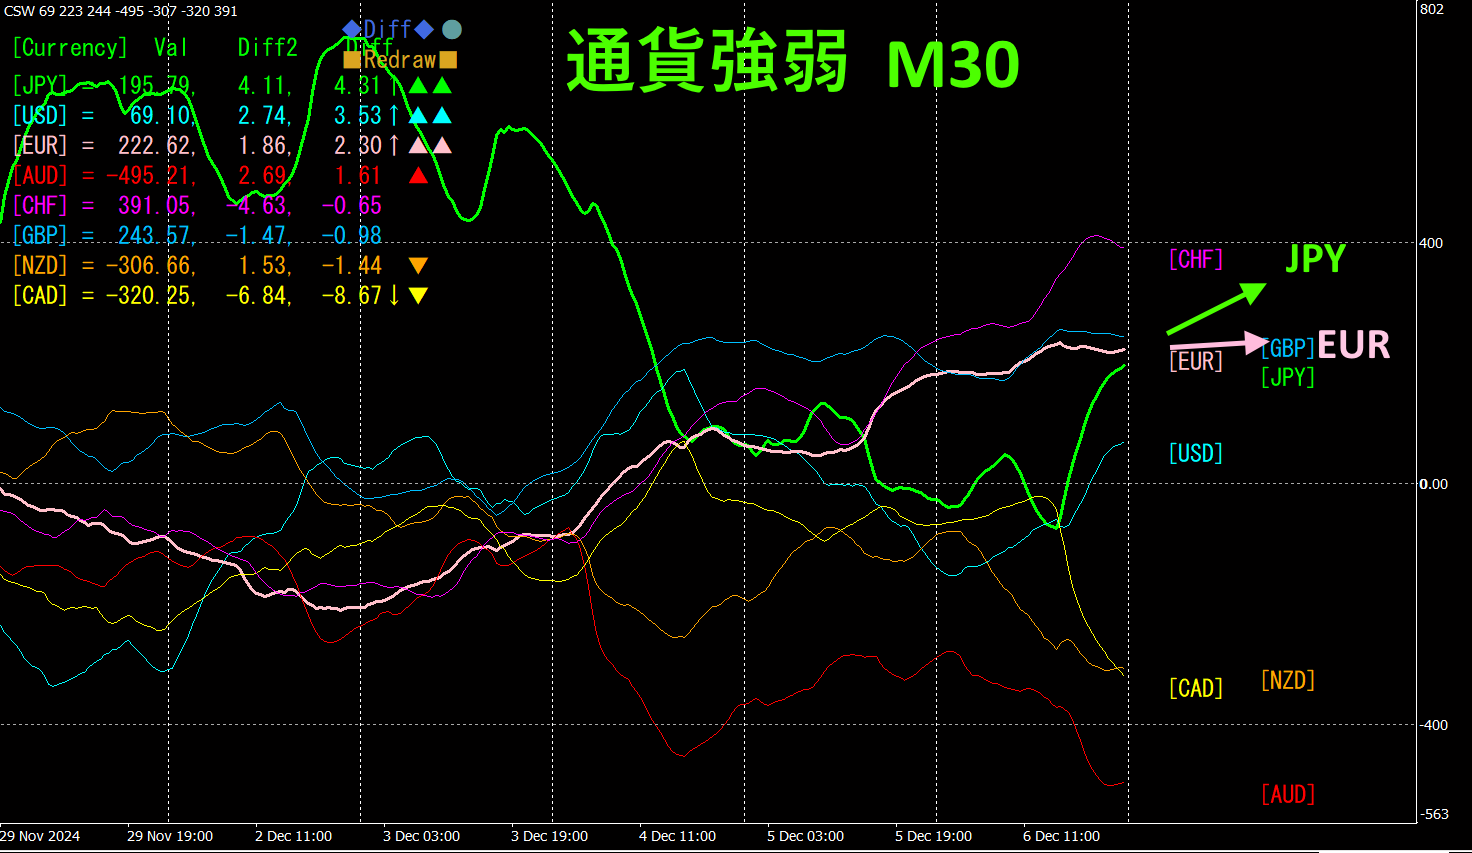
Pink indicatesEUR, green indicates. Currently,JPYJPY>EUR, but the slope is about the same, with a slight tilt towardJPY slightly higher thanEUREUR. EURJPY
1.
NewEA “Swap targetEA”(MT5 version・MT4 version)
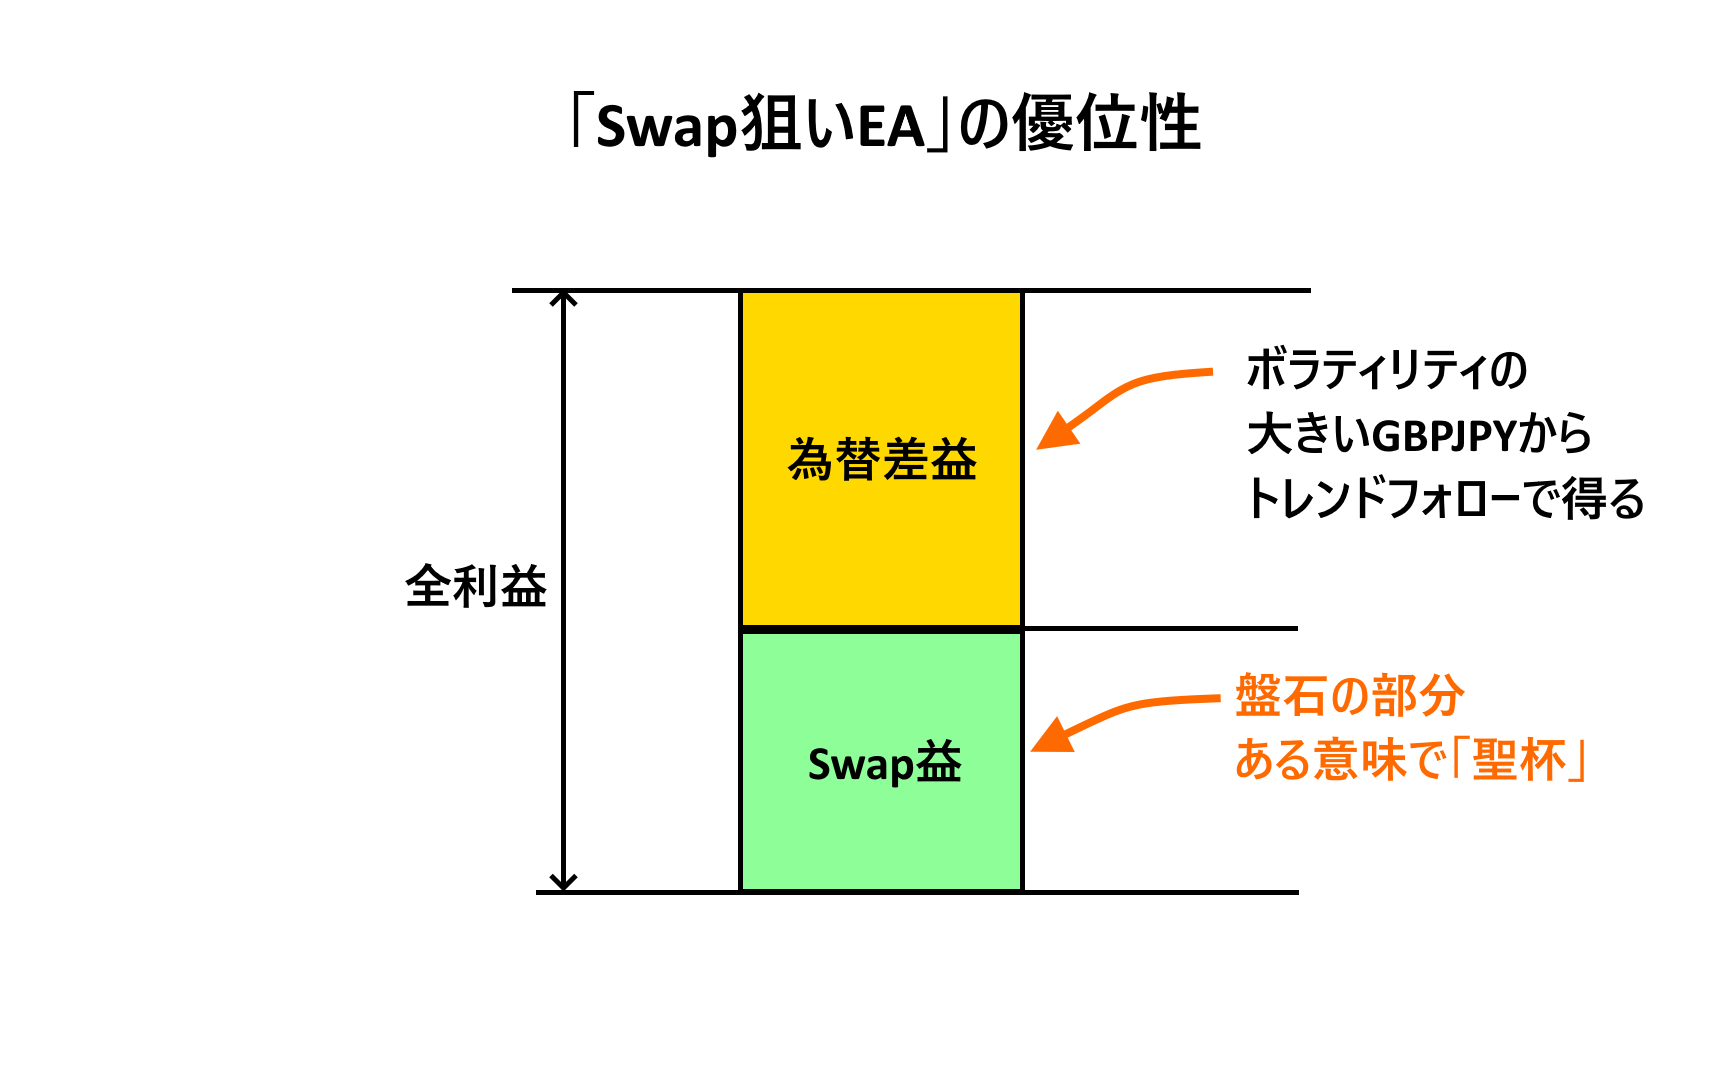
“Swap targetEA” is a type of EA that buys only when there is a trend, aiming to gain both yen difference profits andSwap profits.
“Swap targetEA” is designed so even traders with small funds can grow their capital efficiently. It opens only one long position.The risk (loss ratio) can be freely adjusted by the user, so conservative traders can keep risk low, while traders seeking higher returns with some risk can expect corresponding returns. Depending on settings, it can become an“over-billionaire EA”EA.
version has not started trading yet and is under review.
version was steadily accumulating profits, but currently is in a drawdown and shows a negative. For now, waiting for a recovery.
“Swap targetEA” image illustrating its advantages.
Also, the “Swap targetEA”MT4
MT4 version: linkhttps://www.gogojungle.co.jp/systemtrade/fx/54473
MT5 version: link
https://www.gogojungle.co.jp/systemtrade/fx/54704


5.
Utilization of the “Totore Indicator”
The Totore Indicator has been updated. Added alert function and arrow display. Also added several usage examples. See the product page for details.
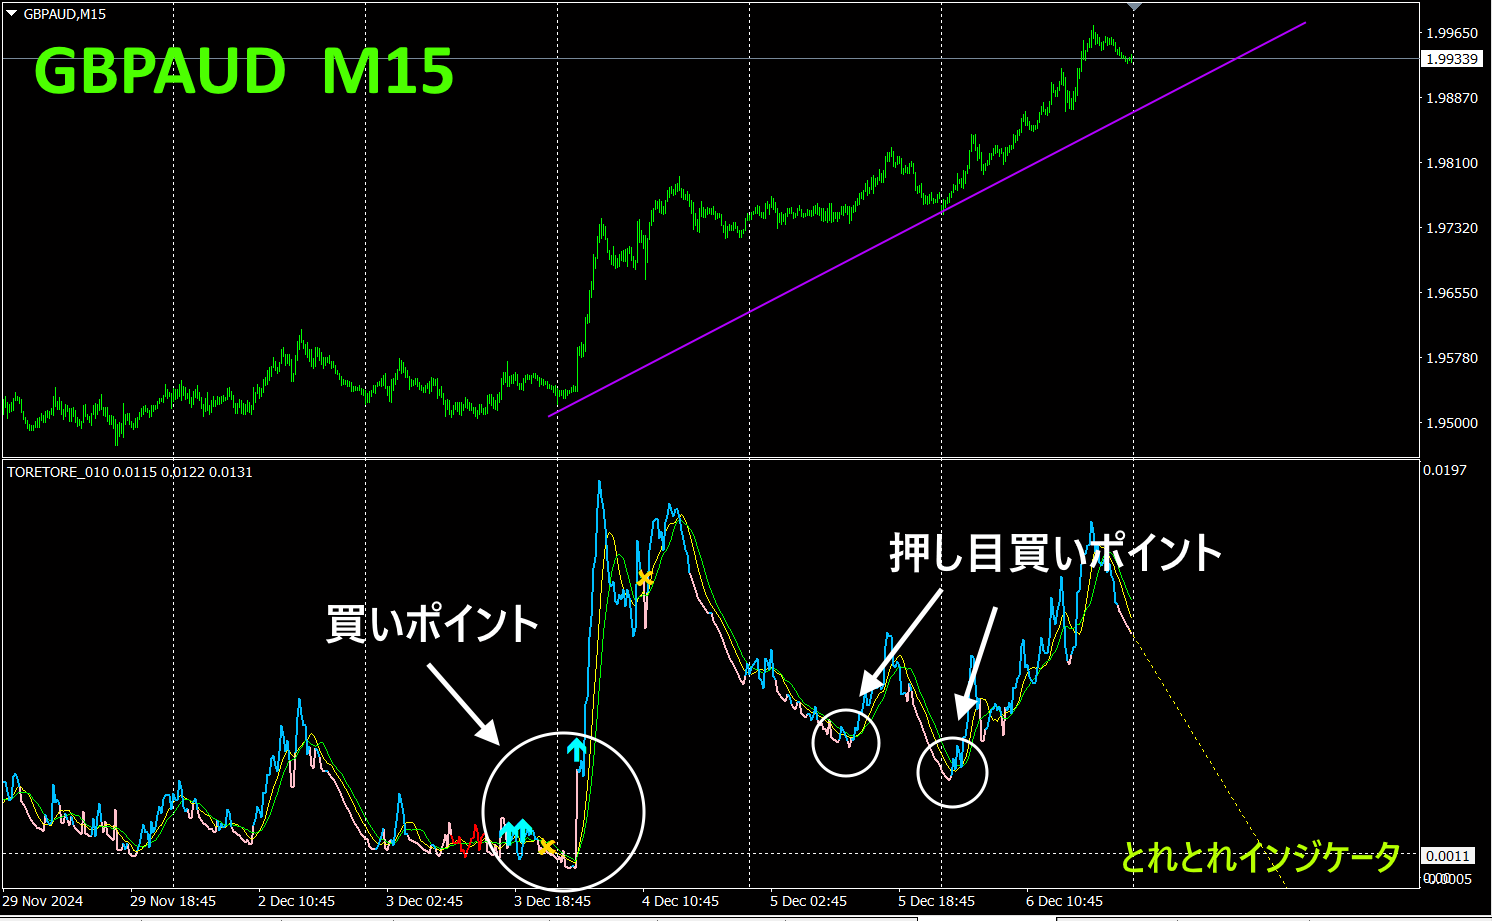
The Totore Indicator is a versatile indicator that can be used in various contexts. The following are application cases for the Totore Indicator. Currency pair used isGBPAUD and the chart is15 minutes.
Because the main line color of the Totore Indicator is blue throughout, you only need to consider “buying” in favorable market conditions. Among these, the buying entry points are in the parts encircled by the large white circles at the top diagram. The pink V-shaped rebound points indicate pullbacks for buying.
Since the “Totore Beam” is pointing downward and there is already around400pips of unrealized profit, it would be prudent to secure profits. If it continues higher, you can simply place another buy position.
If you have the “TrendLine-EX”, you can draw a diagonal rising trendline and automatically close the position when it breaks below it.
6.
Recommended indicators
Totore Indicator
https://www.gogojungle.co.jp/tools/indicators/50115
“TrendLine-EX”


https://www.gogojungle.co.jp/tools/indicators/42257
The “8C Currency Strength Visualization Indicator” is described on the following page.

MT4 version https://www.gogojungle.co.jp/tools/indicators/39150
MT5 version https://www.gogojungle.co.jp/tools/indicators/39159
【My listed products】


