

Thoughts on Logic Using Bollinger Bands③ (Series No.003)
This article is a serial article.
There may be times when it starts in the middle of a conversation, so please go back one article and view it.
This is the third and final introduction of the trading logic using Bollinger Bands.
Statistical basis for “range contrarian trading using ±2σ”
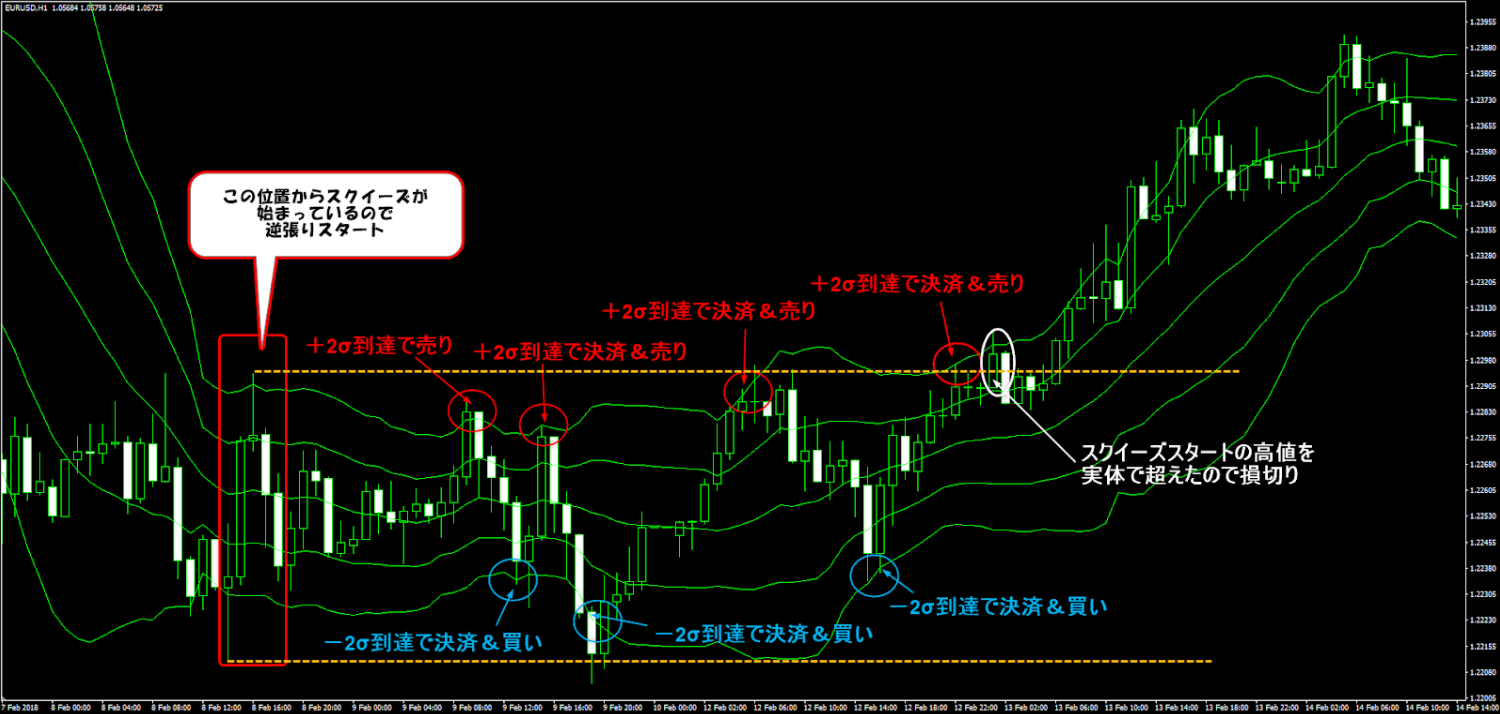
Bollinger Bands are calculated based on probability theory using statistics, andthe probability of staying within ±2σ is 95% or moreis.
Using this property, the strategy targets a squeeze in the Bollinger Bands to perform contrarian trading within a range.
When the Bollinger Bands move horizontally, if the price touches +2σ, sell.
Conversely, if the price touches −2σ, buy.
Execute contrarian trades within the range assuming the price stays within ±2σ of the rangeAs an image, since you never know when the price will break the range, careful measures such as promptly placing a stop loss at a range break are required.
The exit point is when the other side reaches 2σ, or when not being greedy and reaching the opposite side 1σ.
To formalize this into an EA, first determine whether the bands are in a squeeze state.
A good approach is to measure the band width as points. For example, compare the distance between +1σ and +2σ by obtaining the band values.
Once you can obtain this, the next step is to place buy/sell orders when the price crosses the bands, making it easy to implement contrarian trading within the range.
Because this is contrarian, it is also useful to implement a “stop-loss-only exit logic” that exits when the price crosses the upper band, for example, to cut losses early.
This allows you to escape not only by the width of pips but also at an early timing.
Since this cannot be judged visually by looking, it is important to properly build in fallback exit routes.