

Thoughts on Logic Using Bollinger Bands② (Series No.002)
This article is a serialized series.
Since it may start from somewhere in the middle of a discussion, please go back one part to read from the beginning.
This is the second introduction to a trading logic using Bollinger Bands.
Following a Band Walk, a trend-following “dip-buying” and “pullback selling”
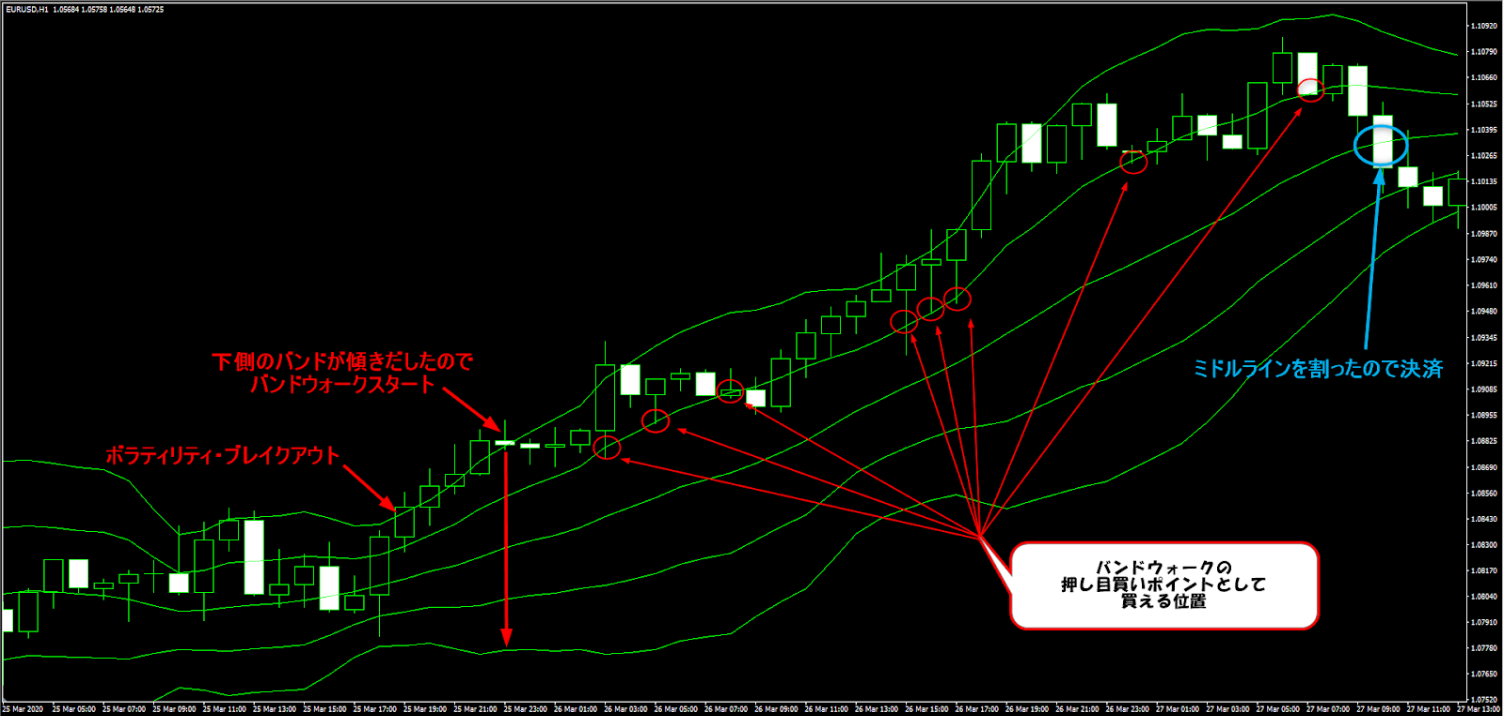
Band Walk is a state in which price moves in one direction while staying between the ±1σ and ±2σ bands.
It is a trend-following trading method that repeats dip-buying and pullback selling in line with the movement direction.
For example, when a band walk occurs between +2σ and +1σ in an uptrend, if the price falls to +1σ, you would buy on the dip.
Conversely, if a band walk occurs between −2σ and −1σ in a downtrend, and the price rises to −1σ, you would sell on the pullback.
The idea is to follow the direction as long as the band walk has not been breached, assuming the price will continue to move in that direction.This is the image.
The exit/settlement point occurs when the middle line is broken by the body of the candle.
To formalize this for an EA, first determine whether a band walk is occurring.
For example, in the upward trend shown in the figure, the condition “regardless of whether the candle is bullish or bearish, the close is above +1σ” defines at what point you judge that a band walk has begun.
Or, another criterion is “when the slope of −2σ on the opposite side aligns with the trend direction, indicating a band walk.”
The former offers more opportunities but more false signals, while the latter has fewer false signals but fewer opportunities.
Once a band walk is confirmed and entry preparation has begun, enter by buying when the price touches +1σ.
If you want to be cautious, you can allow a brief dip below +1σ and only enter once the price returns above +1σ again.
For the exit, respond by breaking the middle line with the candle body, among other methods.
× ![]()