

Points to Predict the Market with Dow Theory Learned from Capital Cat
Hello from Capital Cat! Dow Theory is a powerful tool for investors to predict market movements. Here, we will clearly explain the basic points of Dow Theory and how to apply them to actual trading.
1. What is Dow Theory?
Dow Theory is a theory of market analysis proposed by Charles Dow, based on six fundamental principles.
2. The Six Basic Principles of Dow Theory
The averages discount all information
Market averages (for example, the Dow Jones Industrial Average) are believed to discount all news and economic conditions. This means price movements reflect the overall market state.
There are three kinds of trends in the market
- Primary trend: A long-term trend that lasts more than a year
- Secondary trend: A mid-term trend lasting from 3 weeks to 3 months
- Minor trend: A short-term trend lasting from several days to several weeks
There are three stages to the primary trend
- Accumulation phase: Investors with inside information start to move
- Participation phase: The general investors begin to participate
- Distribution phase: Speculative movement becomes active
Averages must confirm with each other
For example, if both the Dow Jones Industrial Average and the Dow Jones Transportation Average move in the same direction, the trend is considered strong.
Volume is required to confirm the trend
Volume indicates the strength of a trend. In an uptrend, volume typically rises; in a downtrend, volume tends to decrease.
A trend continues until a clear reversal signal appears
A trend continues until a clear reversal signal emerges, requiring careful observation to identify the turning point.
3. Points for Market Forecasting Using Dow Theory
- Confirming the trend: Look at charts to identify the primary, secondary, and short-term trends.
- Understand the stage of the trend: Determine which stage the current trend is in and time entries and exits accordingly.
- Mutual confirmation: Check multiple averages to confirm the trend direction.
- Check volume: Look at trading volume to confirm the trend strength.
- Identify turning signals: Until a clear trend reversal signal appears, trade in line with the trend.
4. Dow Theory Implementation Tips
- Regular chart analysis: Observe daily market movements and stay sensitive to changes in trends.
- Risk management: Not only follow the trend, but also implement risk management to minimize losses.
- Continue learning: Market moves are always changing, so a mindset of continuous learning is important.
5. Try Dow Theory with LineTradeExpert
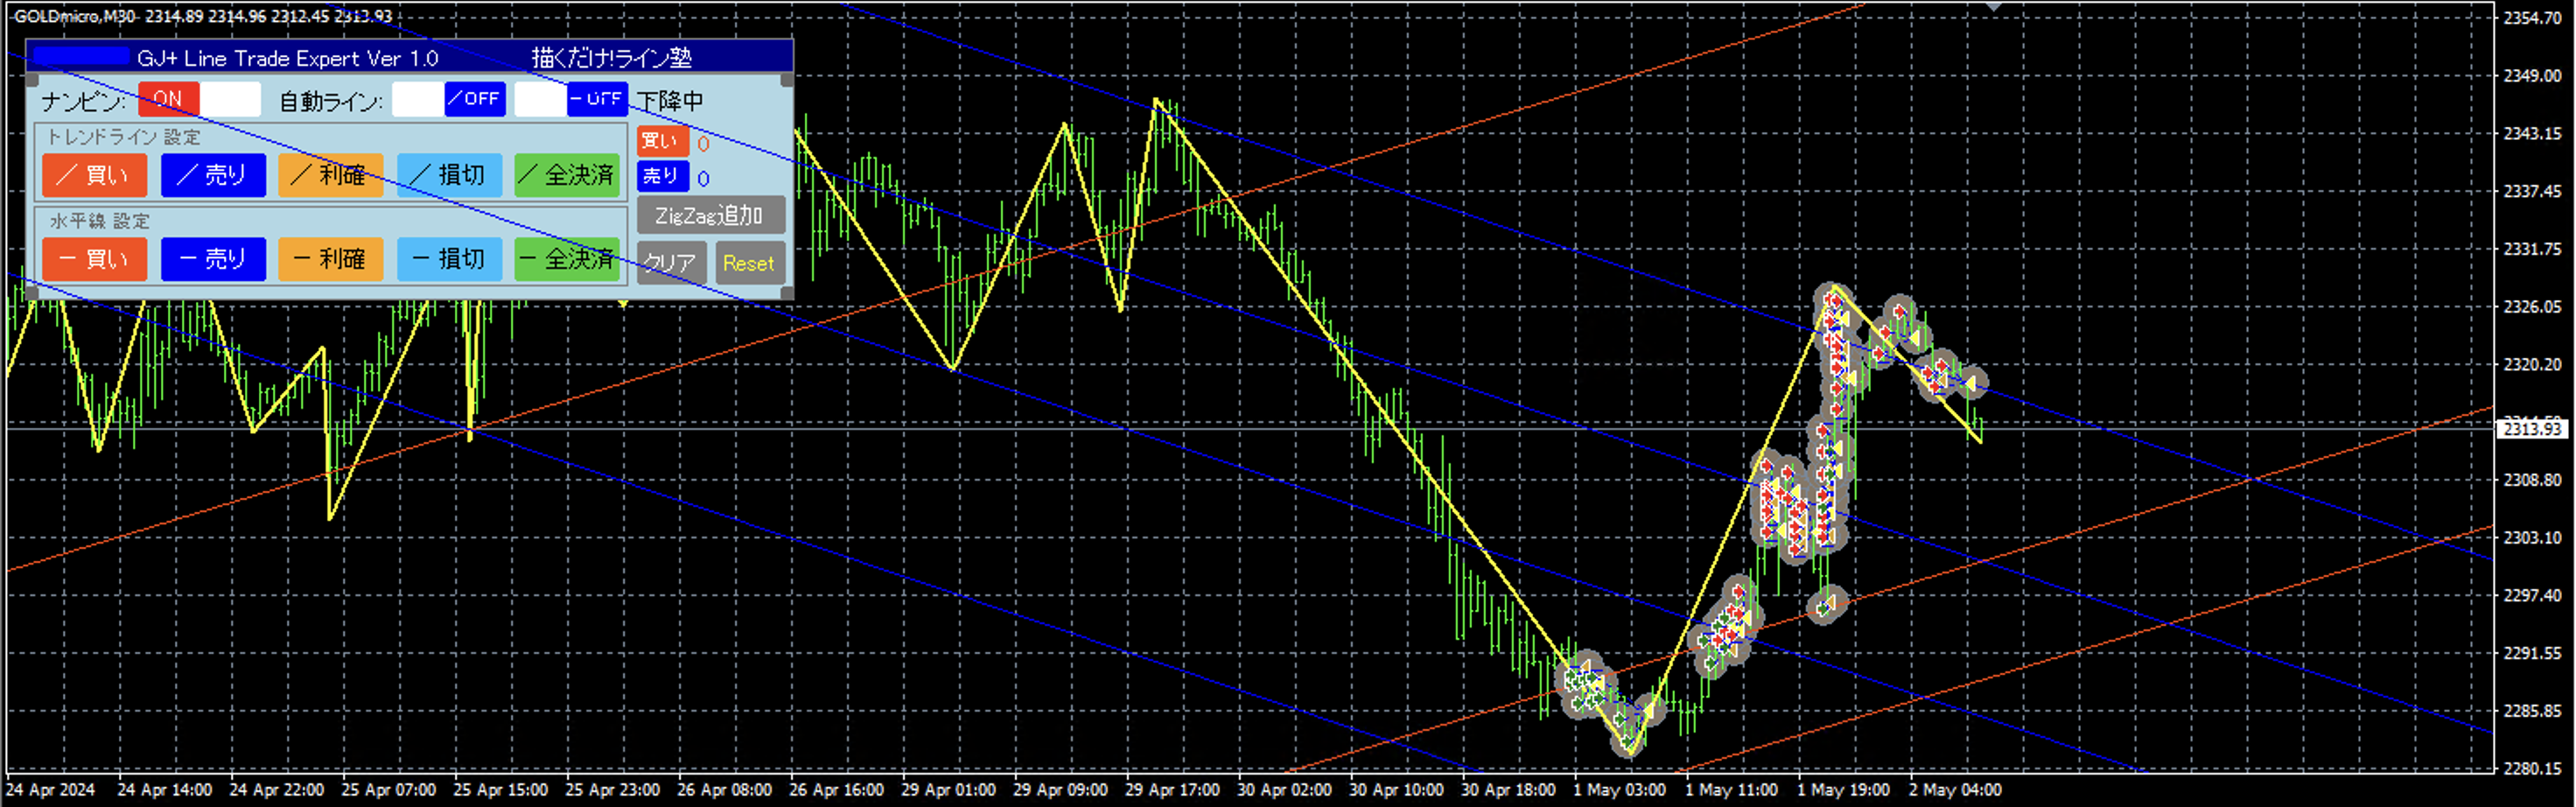
First, check the price movement of the last month.
Use an M30 chart, and zoom out with the scale feature so the trend can be seen.
Add the ZigZag indicator to make it easier to grasp.
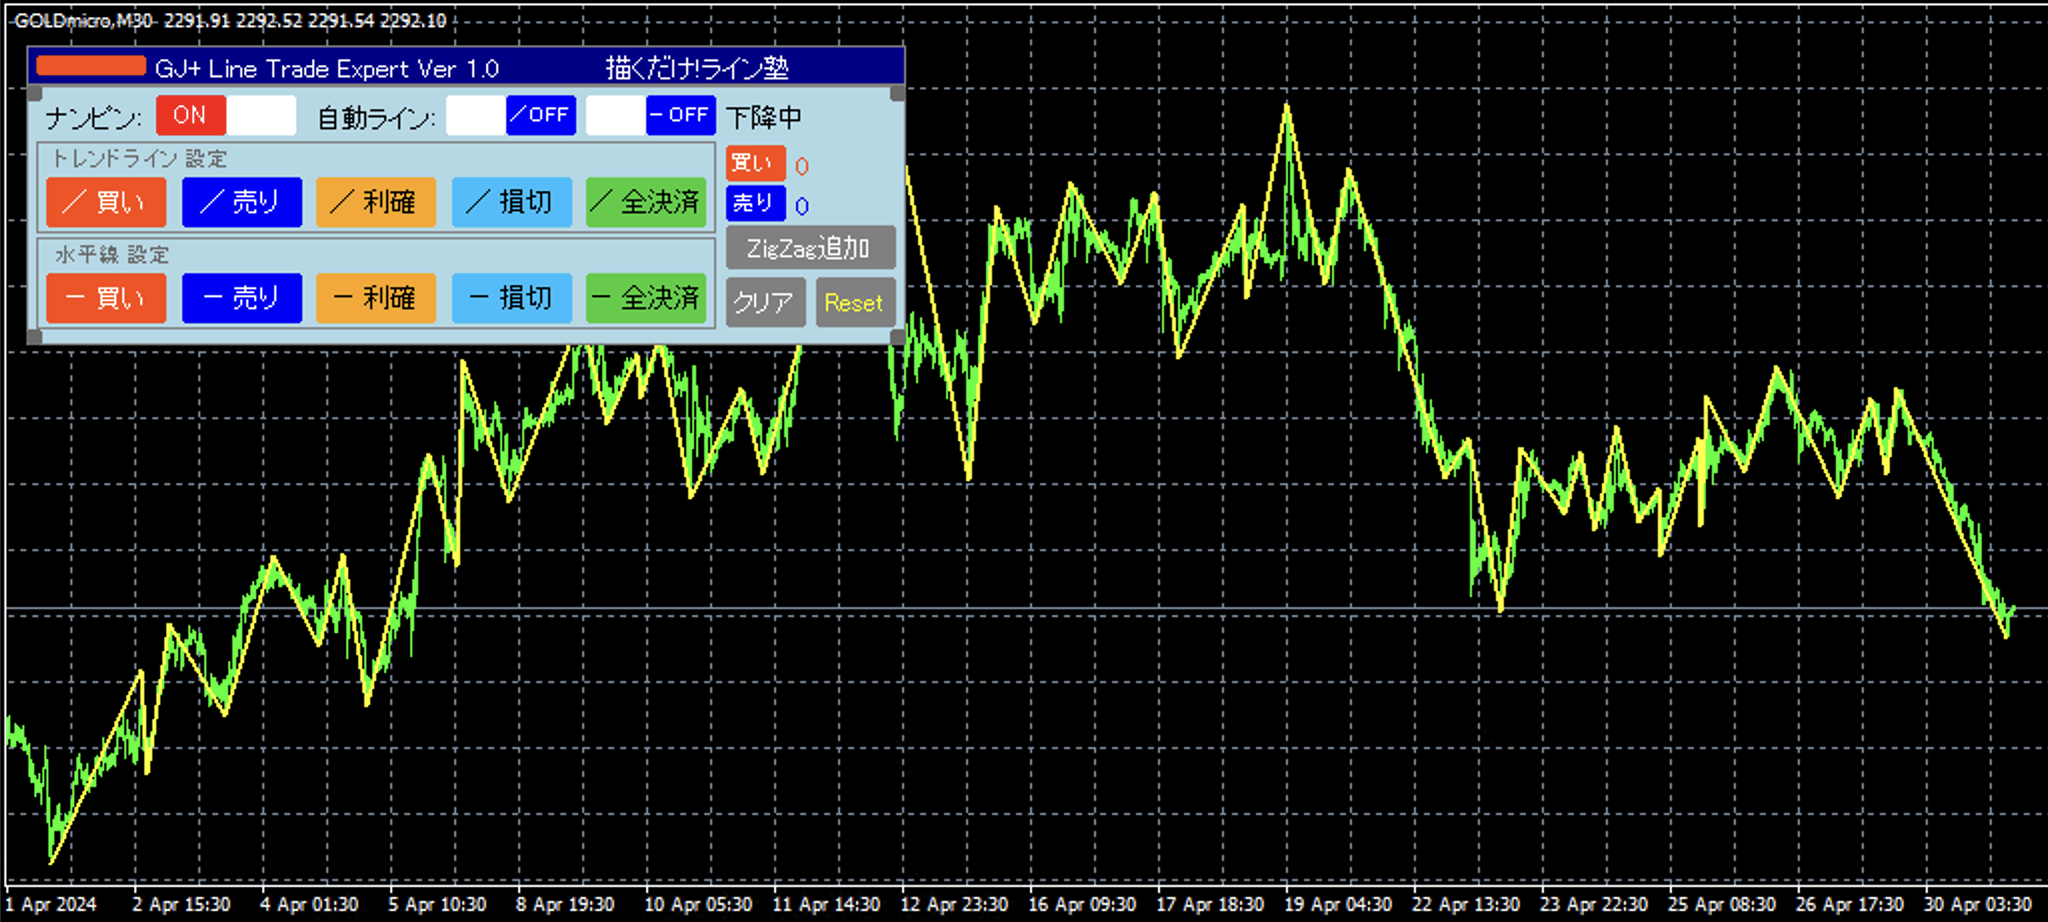
From a one-month view, the trend is upward
Try to forecast the angle of the upcoming uptrend by aligning it with the most recent uptrend.
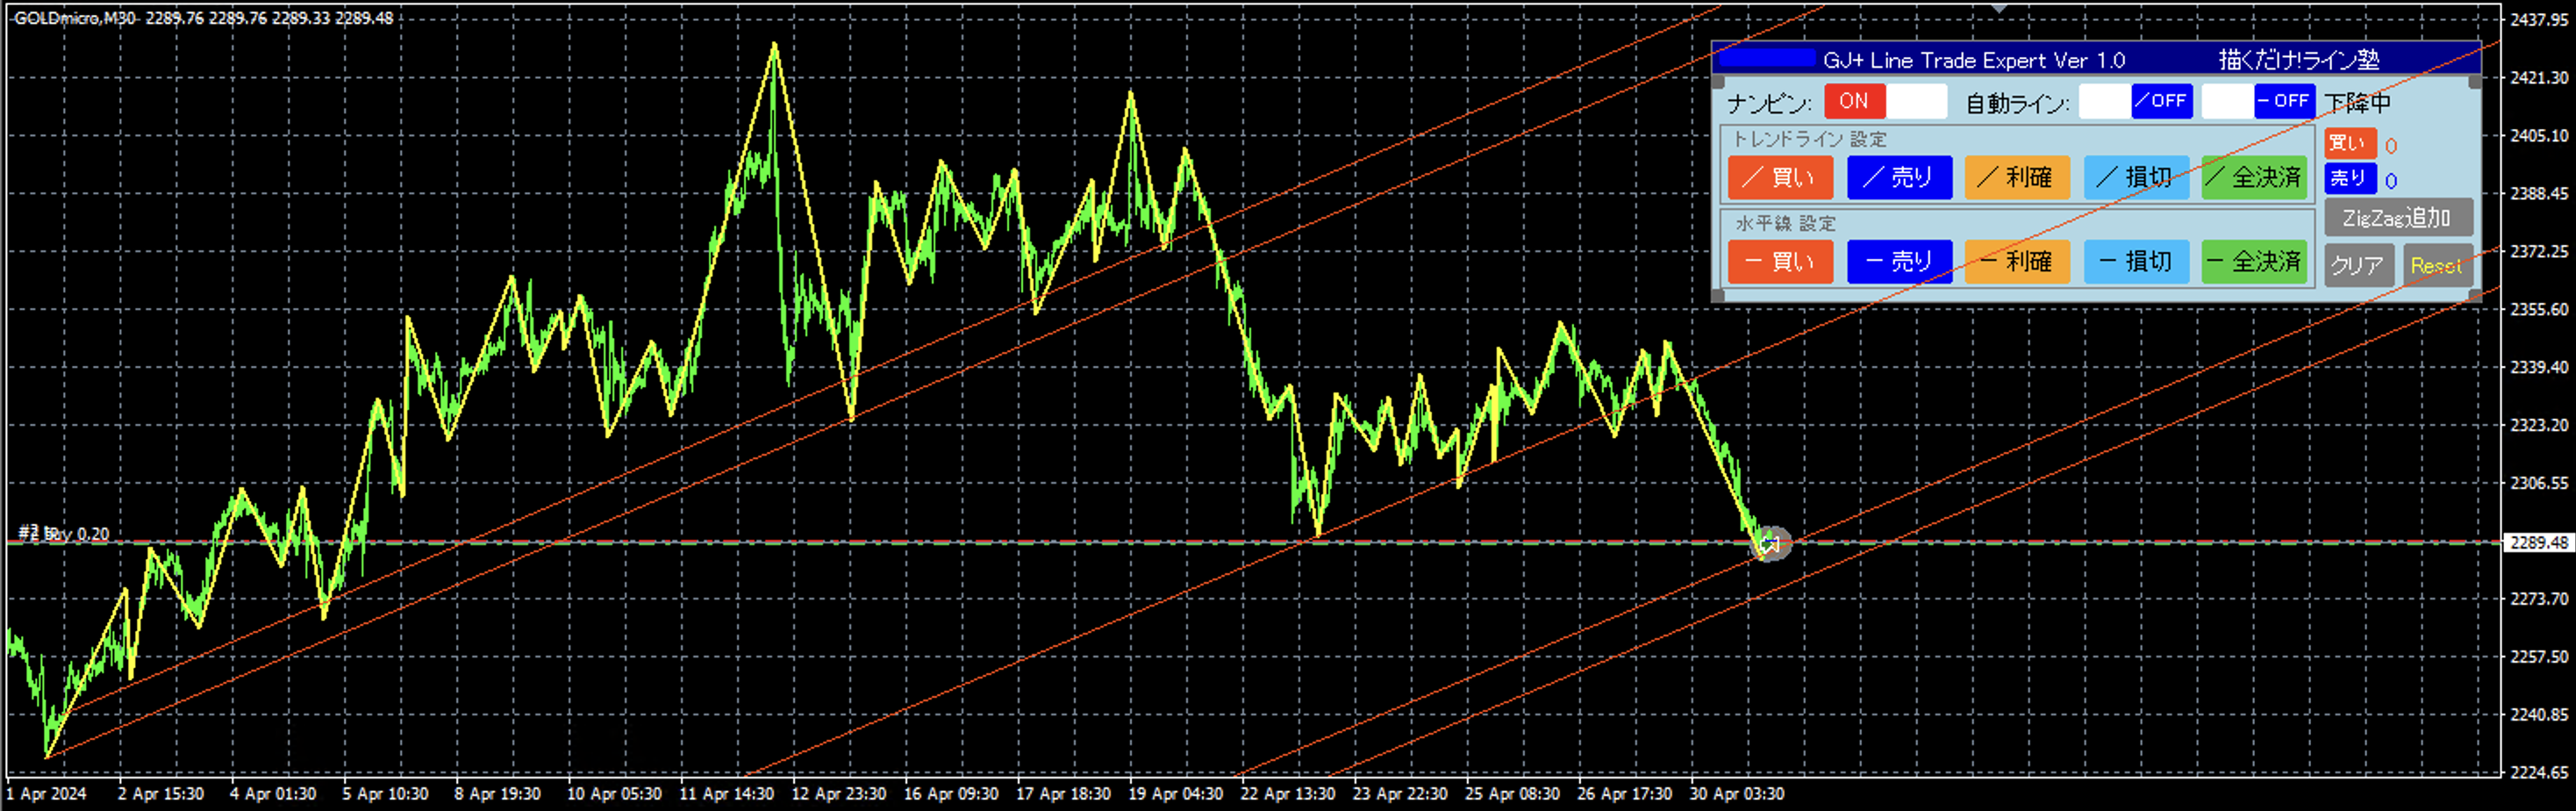
From recent price movement, a downtrend appears likely
Recent trends suggest a downtrend is likely.
Draw trendlines, and draw 3–4 parallel lines to estimate a potential drop.
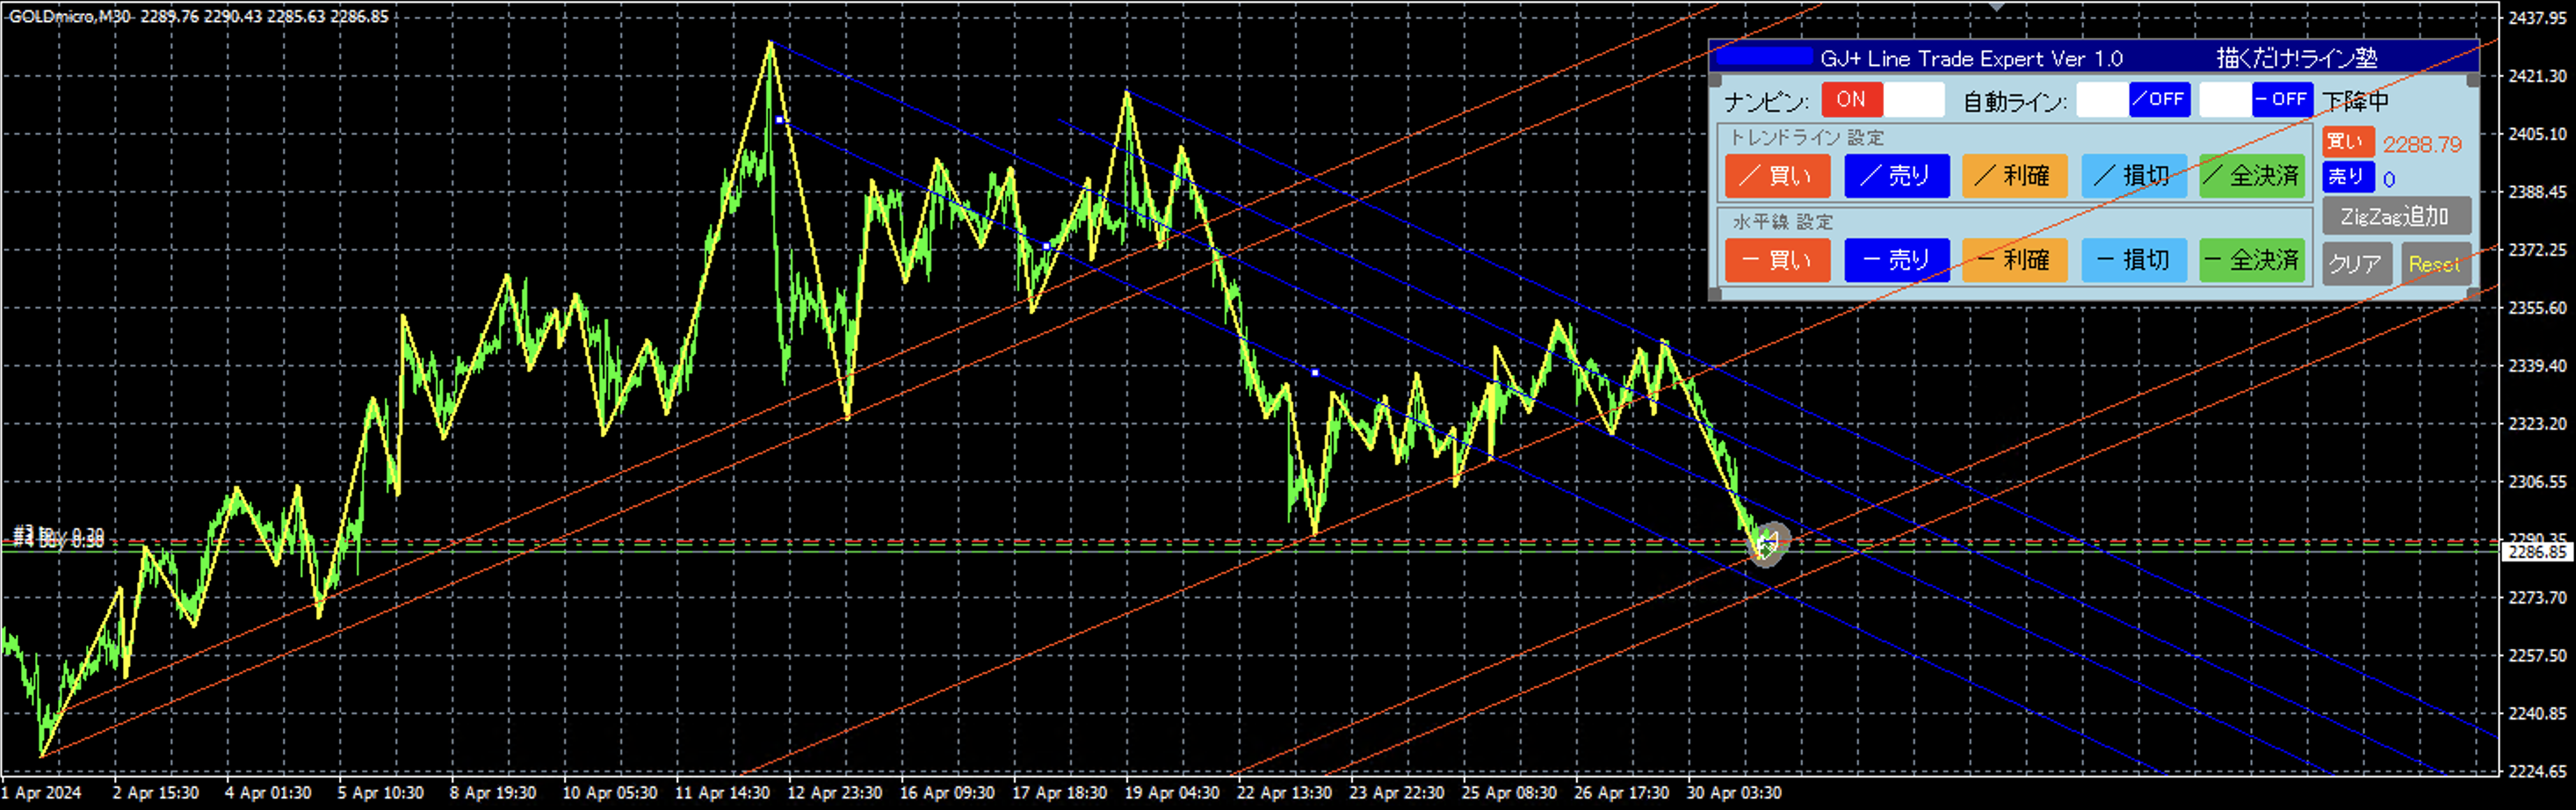
Check the range of price movement
In a averaging plan (averaging down) for a compensating trade, check the recent range of price movement.
How many dollars up at most, how many dollars down at most, and how big a move is needed for a rebound
If a rebound occurs, estimate on average how many dollars it will rebound.
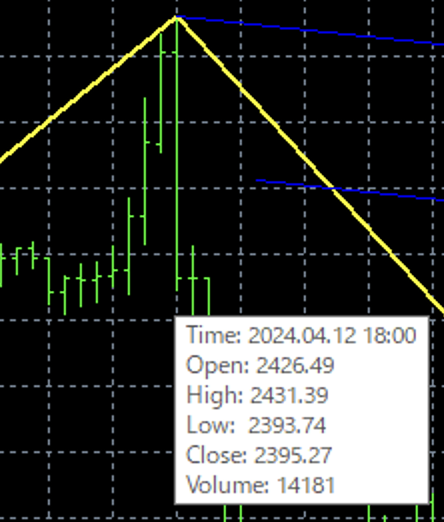
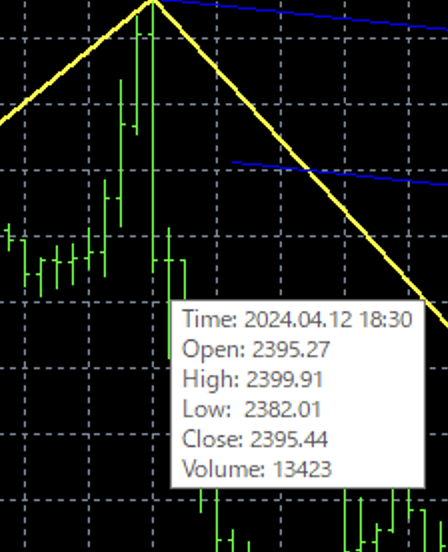
These two candles move the most, so we will look at this price variation
With High 2431.39 → Low 2393.74, a movement of 37.65 dollars is observed
And in the next candle, it rebounds to High 2399.91, indicating a 6.16 dollar rebound
- Use a capital management sheet to confirm safe settings
Even if it moves 38 dollars, it’s okay; look for settings where you take profit after a 5.5-dollar return.
For safety, you can allow 40 dollars movement and take profit after a 5-dollar pullback.In this way, treat the amount of movement as generous and the profit target as smaller.
Then trust the drawn lines and the position sizing according to capital management, and wait!
Just draw! The essence of Line School is to draw the lines and then wait.
Now check the profitability.
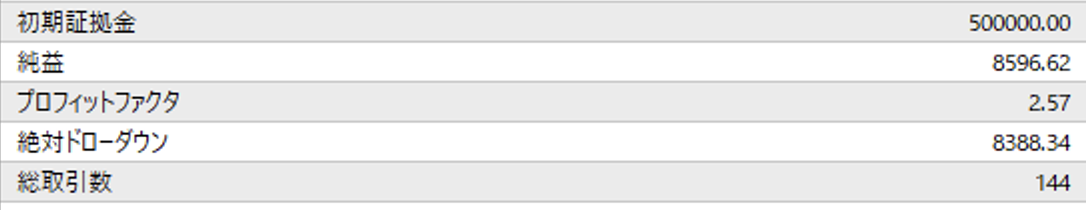
Pretty good.
First, check the price movement of the last month.
Use an M30 chart, and zoom out with the scale feature so the trend can be seen.
Add the ZigZag indicator to make it easier to grasp.
From a one-month view, the trend is upward
Try to forecast the angle of the upcoming uptrend by aligning it with the most recent uptrend.
From recent price movement, a downtrend appears likely
Recent trends suggest a downtrend is likely.
Draw trendlines, and draw 3–4 parallel lines to estimate a potential drop.
Check the range of price movement
In a averaging plan (averaging down) for a compensating trade, check the recent range of price movement.
How many dollars up at most, how many dollars down at most, and how big a move is needed for a rebound
If a rebound occurs, estimate on average how many dollars it will rebound.
These two candles move the most, so we will look at this price variation
With High 2431.39 → Low 2393.74, a movement of 37.65 dollars is observed
And in the next candle, it rebounds to High 2399.91, indicating a 6.16 dollar rebound
Then trust the drawn lines and the position sizing according to capital management, and wait!
Just draw! The essence of Line School is to draw the lines and then wait.
Now check the profitability.
Pretty good.
Message from Capital Cat
Dow Theory is a powerful tool for understanding and predicting market movements. By applying this theory, you can make smarter investment decisions. Learn Dow Theory with me and aim for investment success!