
We are releasing a new EA, "Wave Rider Kinjiro"! Can it cover the slump of the previous work, SuperRecovery?!
I was endlessly torn whether to release a new work while Super Recovery was having issues, but since there is still a possibility that the new work could cover Super Recovery, I will bravely publish the new work.
The new work is “Friend of the Waves: Kinjiro” created to compensate for Super Recovery losses after the launch of Super Recovery.
About three months have passed since development, and since there is a prospect for release, I decided to make it public.
Will the new work cover the prolonged slump in Super Recovery where profits were not being made? I am full of both expectations and anxiety about this.
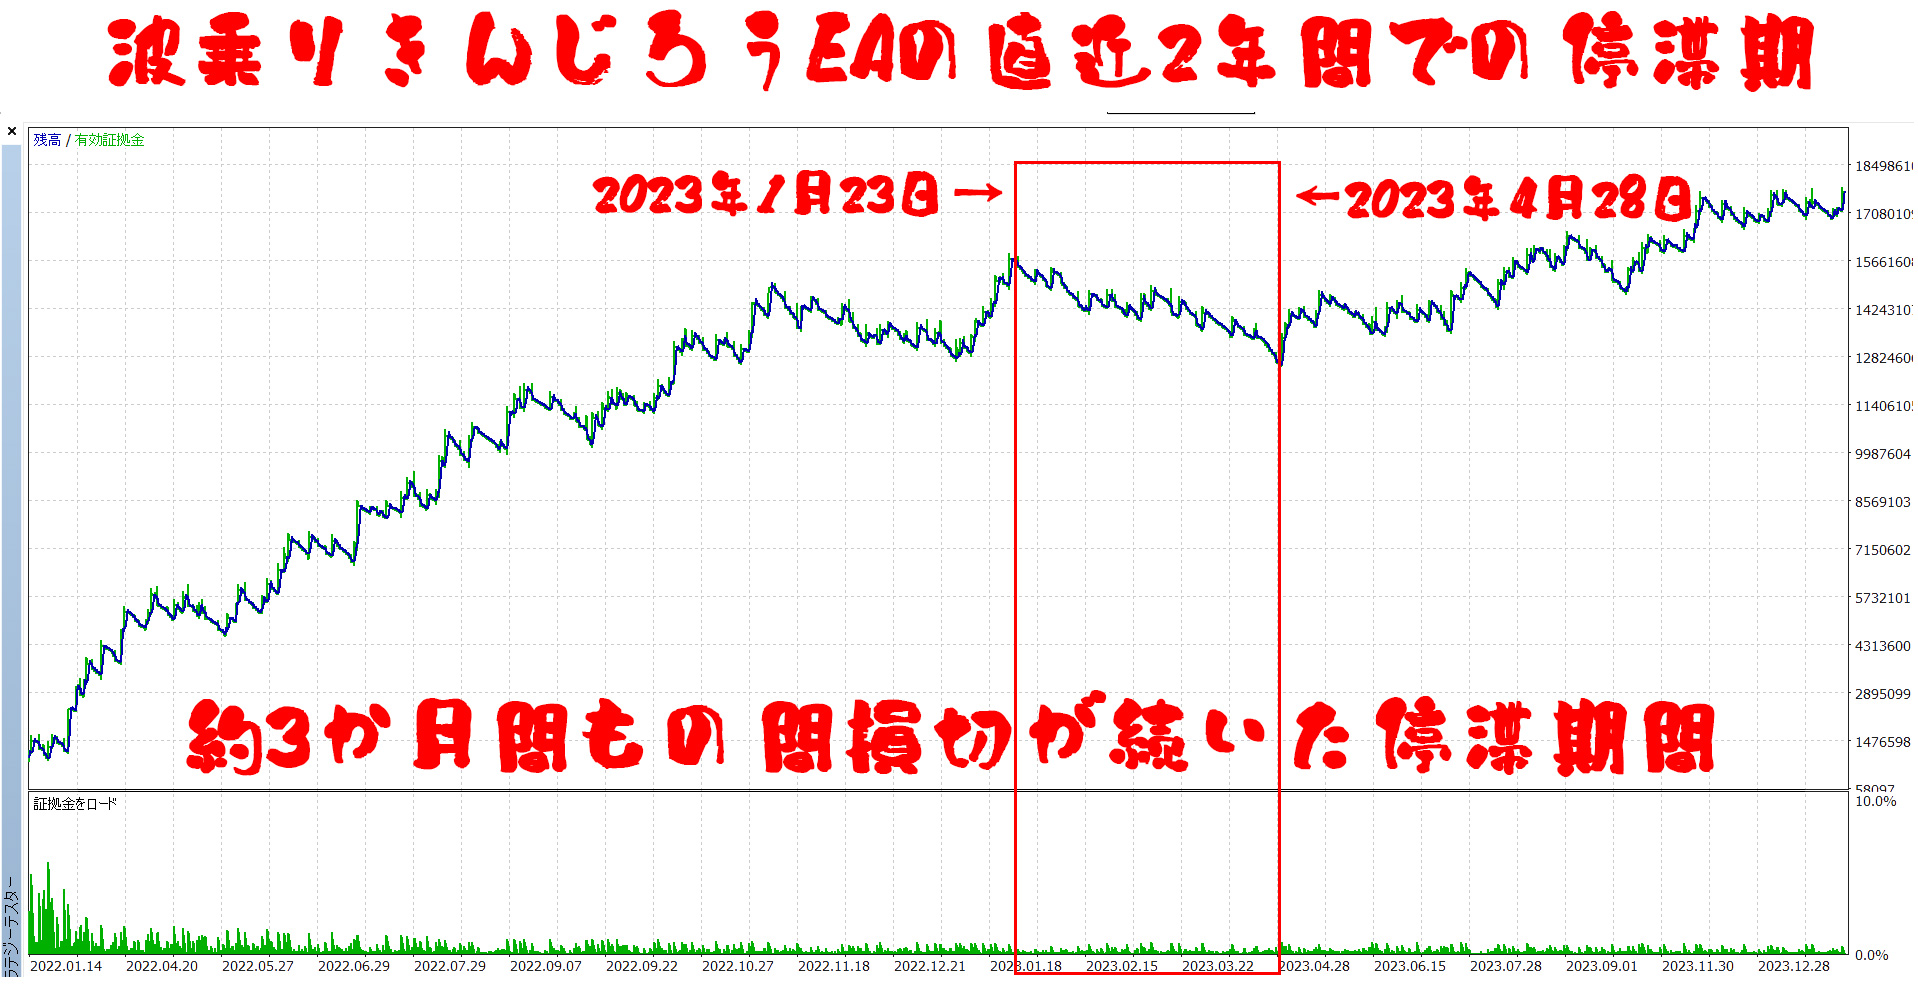
Super Recovery is still not performing well, and when considering the causes, it relates to the rapid increase in capital flowing into the USD/JPY market from 2022 onward—the “big bull market” where the USD/JPY surged from around 110 to over 150 due to expanded volume.
Logics and parameters optimized for a big bull market cannot respond quickly to long periods of ranging markets with trend-following MA logic, as seen last year.
The biggest feature of Super Recovery for bull markets is that by employing a pyramiding method during such sharp, extreme volatility, the backtest for 2022 was outstanding.
The figure below shows Super Recovery’s test results for the full year 2022, where 100,000 yen grew to 50 million yen.
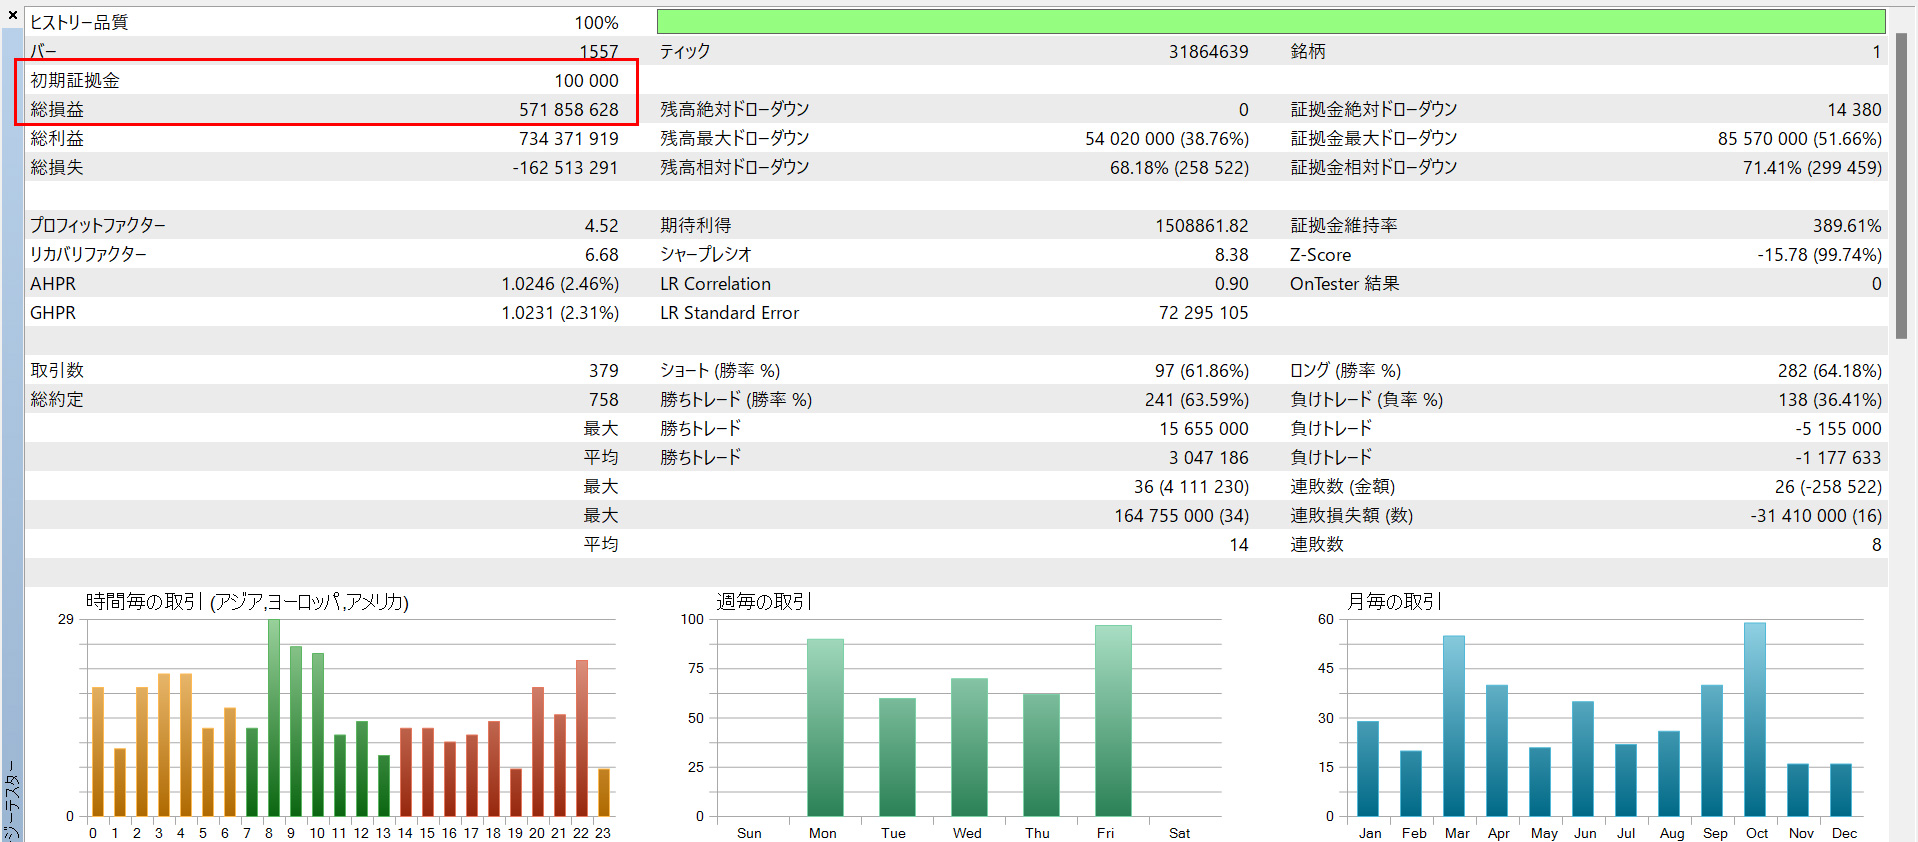
However, in 2023, the figure shows that 100,000 yen only increased to 600,000 yen.
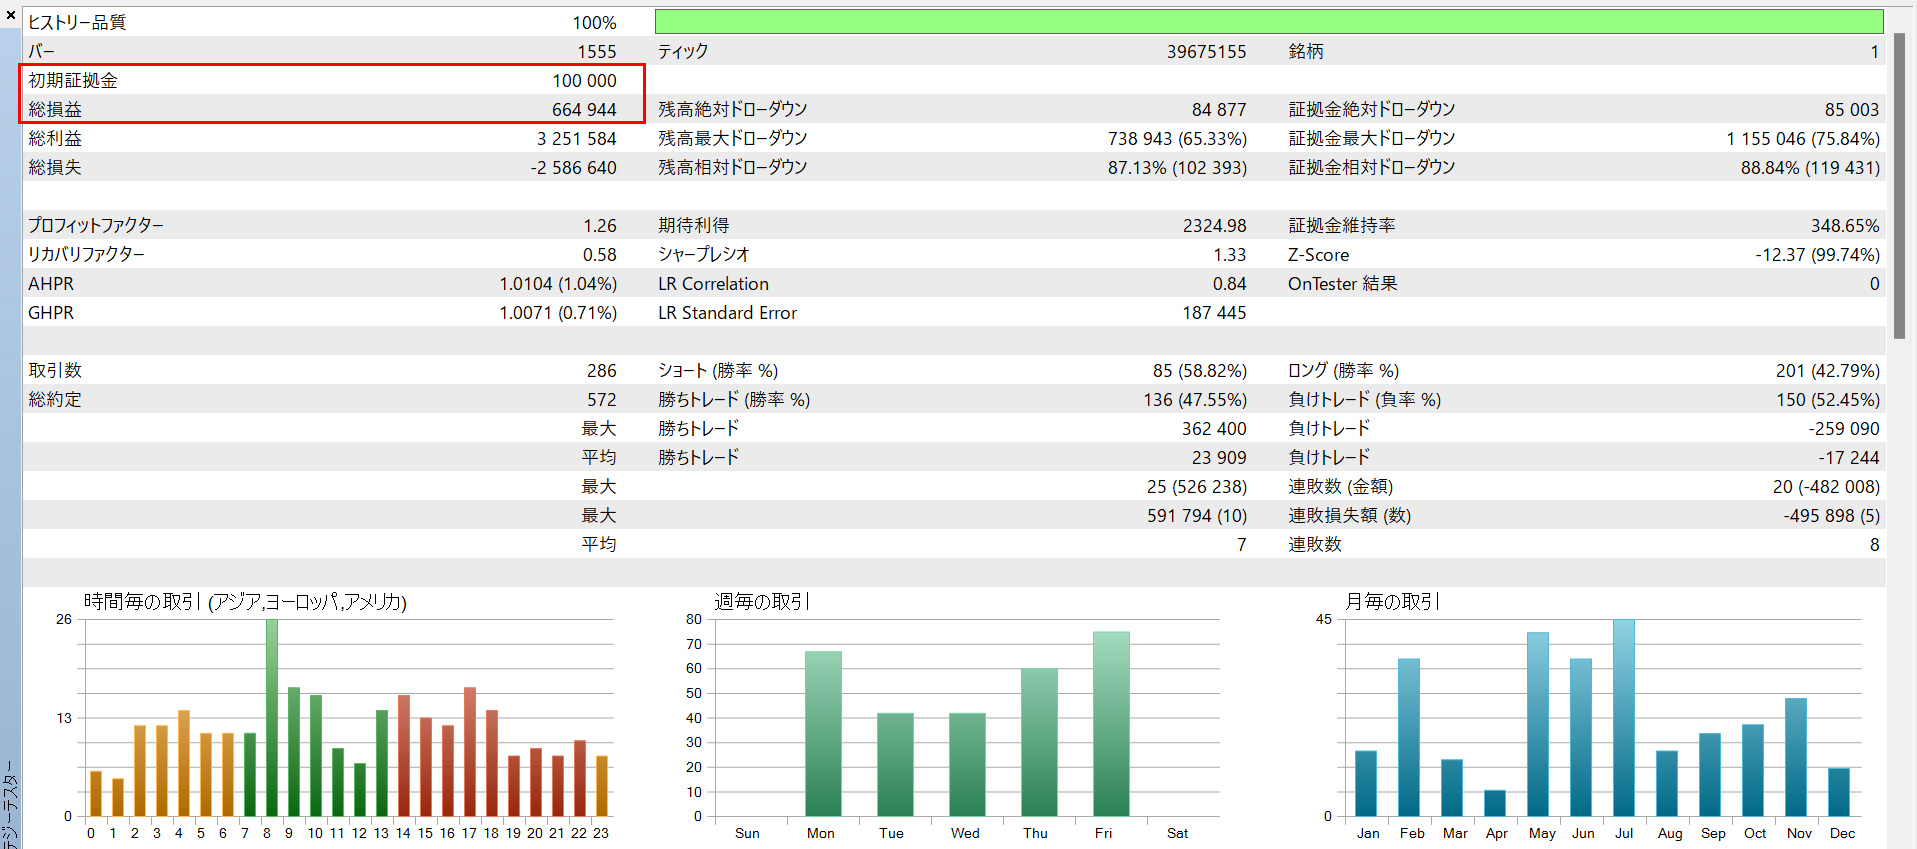
We believe these extreme differences in total profit and loss are largely due to the magnitude and duration of market trends.
GuppyEA, the creator of Super Recovery, uses the same 4-hour logic, yet its profit from 2022 to 2023 grew to around 100 million yen from 100,000 yen, with win rates of 100% for shorts and 96% for longs, showing strong performance last year as well.
Trading frequency over two years has been relatively low at 60 instances, but it has produced steady profits in 2023 as well.
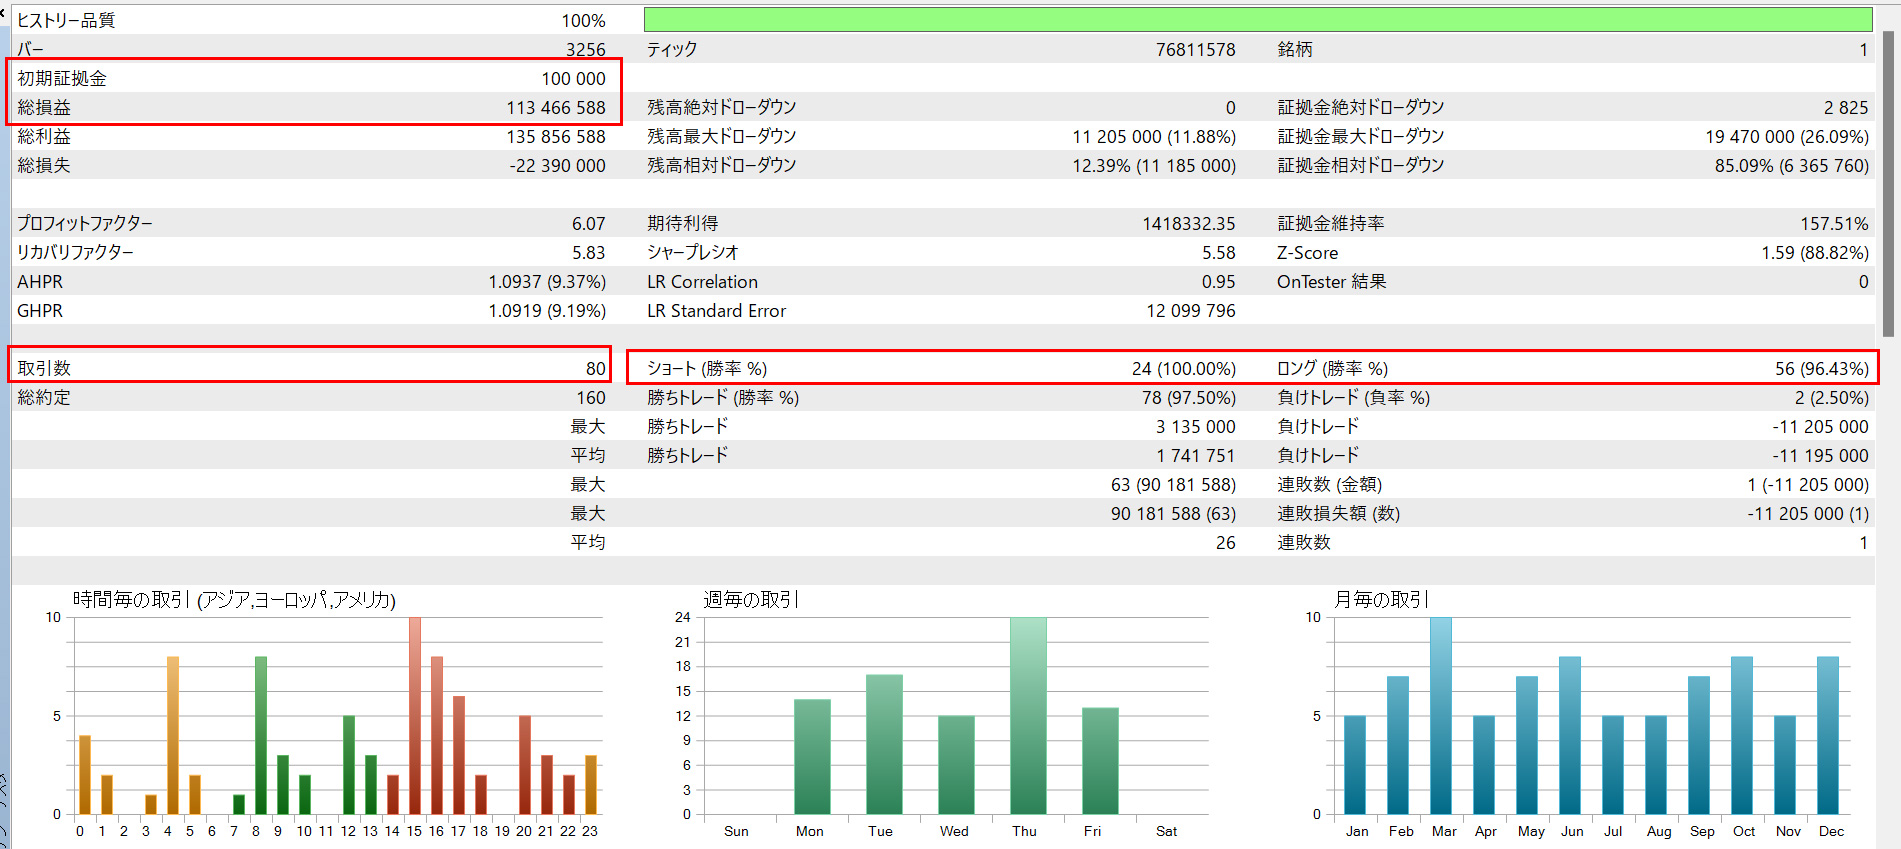
The idea behind developing Super Recovery—the method that anticipated that the 2022 bull market would continue into 2023—also became its biggest weakness, causing the range-bound market in 2023 to trigger frequent stop-outs when trends were small.
What will happen this year is anyone’s guess...
Especially around the end of last year, government interventions and US rate hikes caused the yen to move unexpectedly, and fears of intervention led to rapid declines, revealing that the MA’s strength in steady responses did not apply to Super Recovery’s weakness in initial reaction.
As of today (February 1, 2024), the USD/JPY is oscillating between expectations of a Federal Reserve rate cut and a US recession concern and Japan’s rate hikes, creating wild swings.
This is precisely where a long-range MA-based pyramiding method struggles in such wide-ranging markets.
Currently, Super Recovery’s logic centers on the most recent high and low of the 4-hour timeframe, but in recent markets, after the 4-hour high is broken, prices push down hard and then rise sharply again, making it difficult for MA to keep up—a major reason for the losses.
From the start, I anticipated some range-bound weakness, but when the range-bound market lasts this long, a trend-following MA-based pyramiding approach does not perform well.
In short, Super Recovery is now in a trend-waiting state, and the question is how long it can endure losses.
Specifically, if prices rise past 152 yen and push toward 160–170, Super Recovery could yield large profits similar to 2022.
Or, if prices break below 145 yen and head toward 130–120, I believe the EA could also deliver substantial profits.
Until markets become such extreme and clear, profit expansion may be difficult.
For high-leverage or high-risk traders, this is a painful caution for Super Recovery at present.
Another characteristic of Super Recovery lies in its risk-reward approach.
It aims for small risks and large rewards. In the current version, the stop loss is 204 pips, while the take profit is 312 pips, which is relatively large.
In reality, many cases involve trailing or MA settlements to secure smaller profits, but I believe a more granular profit-taking logic is necessary.
In the new work, “Friend of the Waves: Kinjiro,” I have increased the number of trades to about 7,000 over two years by reducing maximum profit per trade and by trimming take-profit and trailing features.
In other words, the new EA is a move from swing-type Super Recovery to a scalping-type Kinjiro.
Of course, depending on timing, Kinjiro may carry positions to the next day or week.
Super Recovery conducts around 700 trades over two years, while the new Kinjiro does about ten times that, around 7,000 trades.
Moreover, Kinjiro trades only on Wednesday, Thursday, and Friday within a single week, reducing activity to three days out of five, yet the total number of trades is ten times higher, indicating a highly active trading frequency.
In short, the idea for Kinjiro arose from lessons learned from Super Recovery’s underperformance.
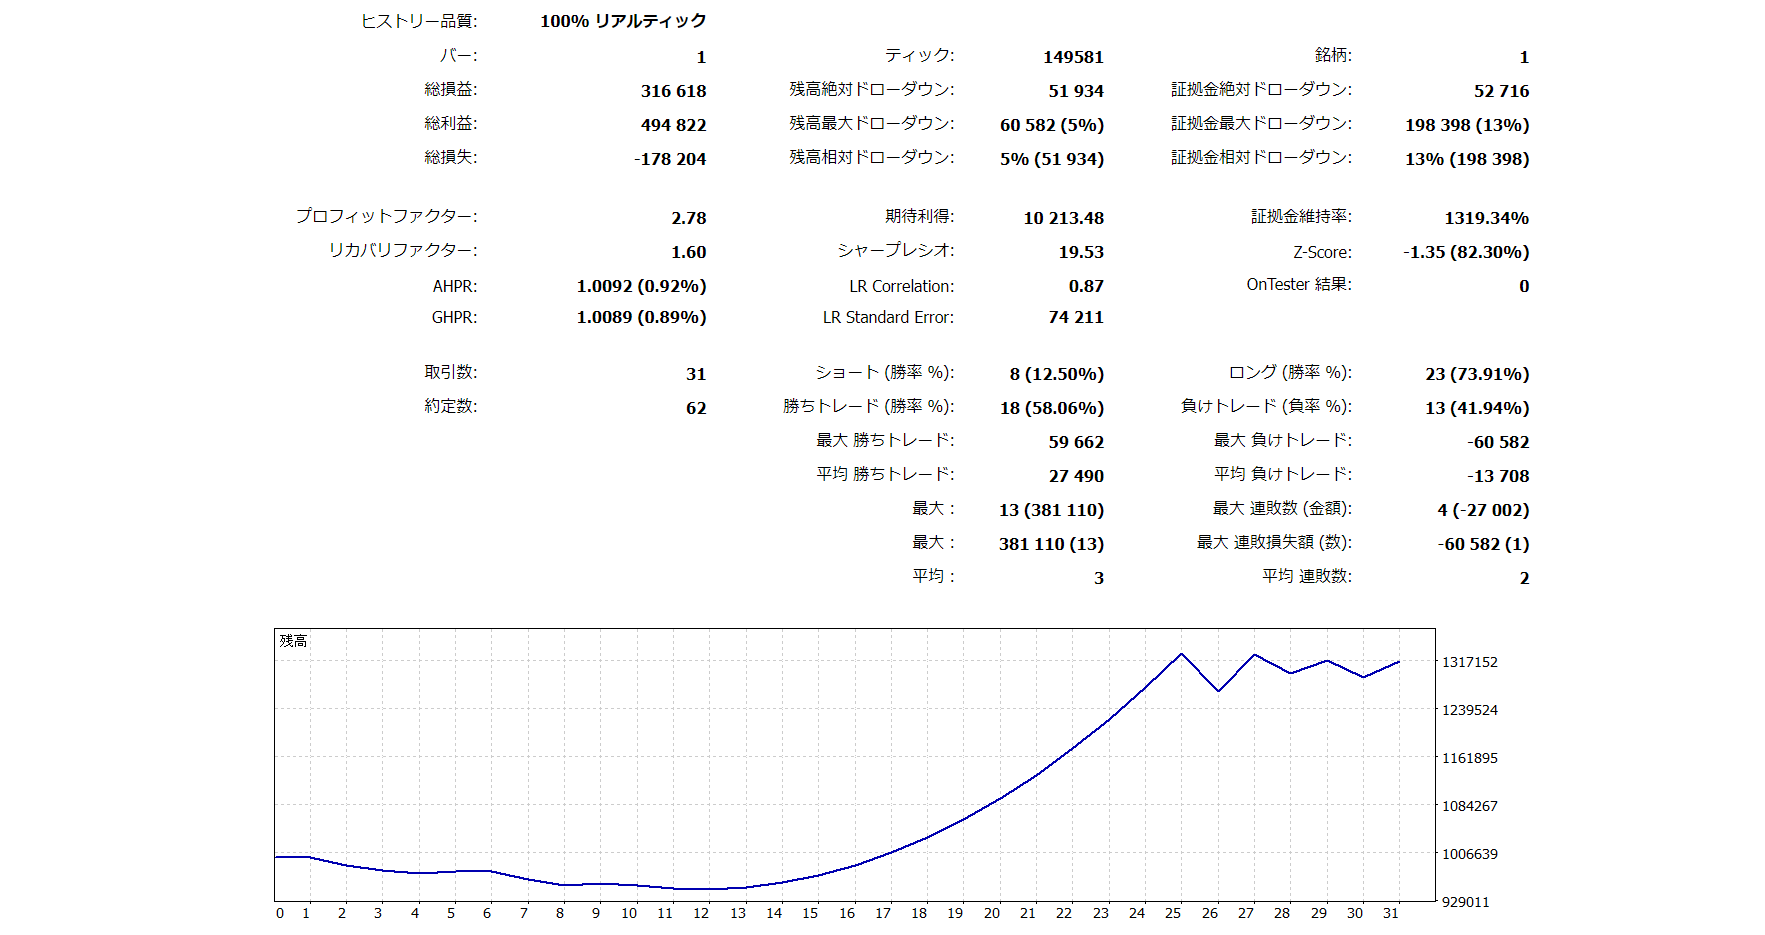
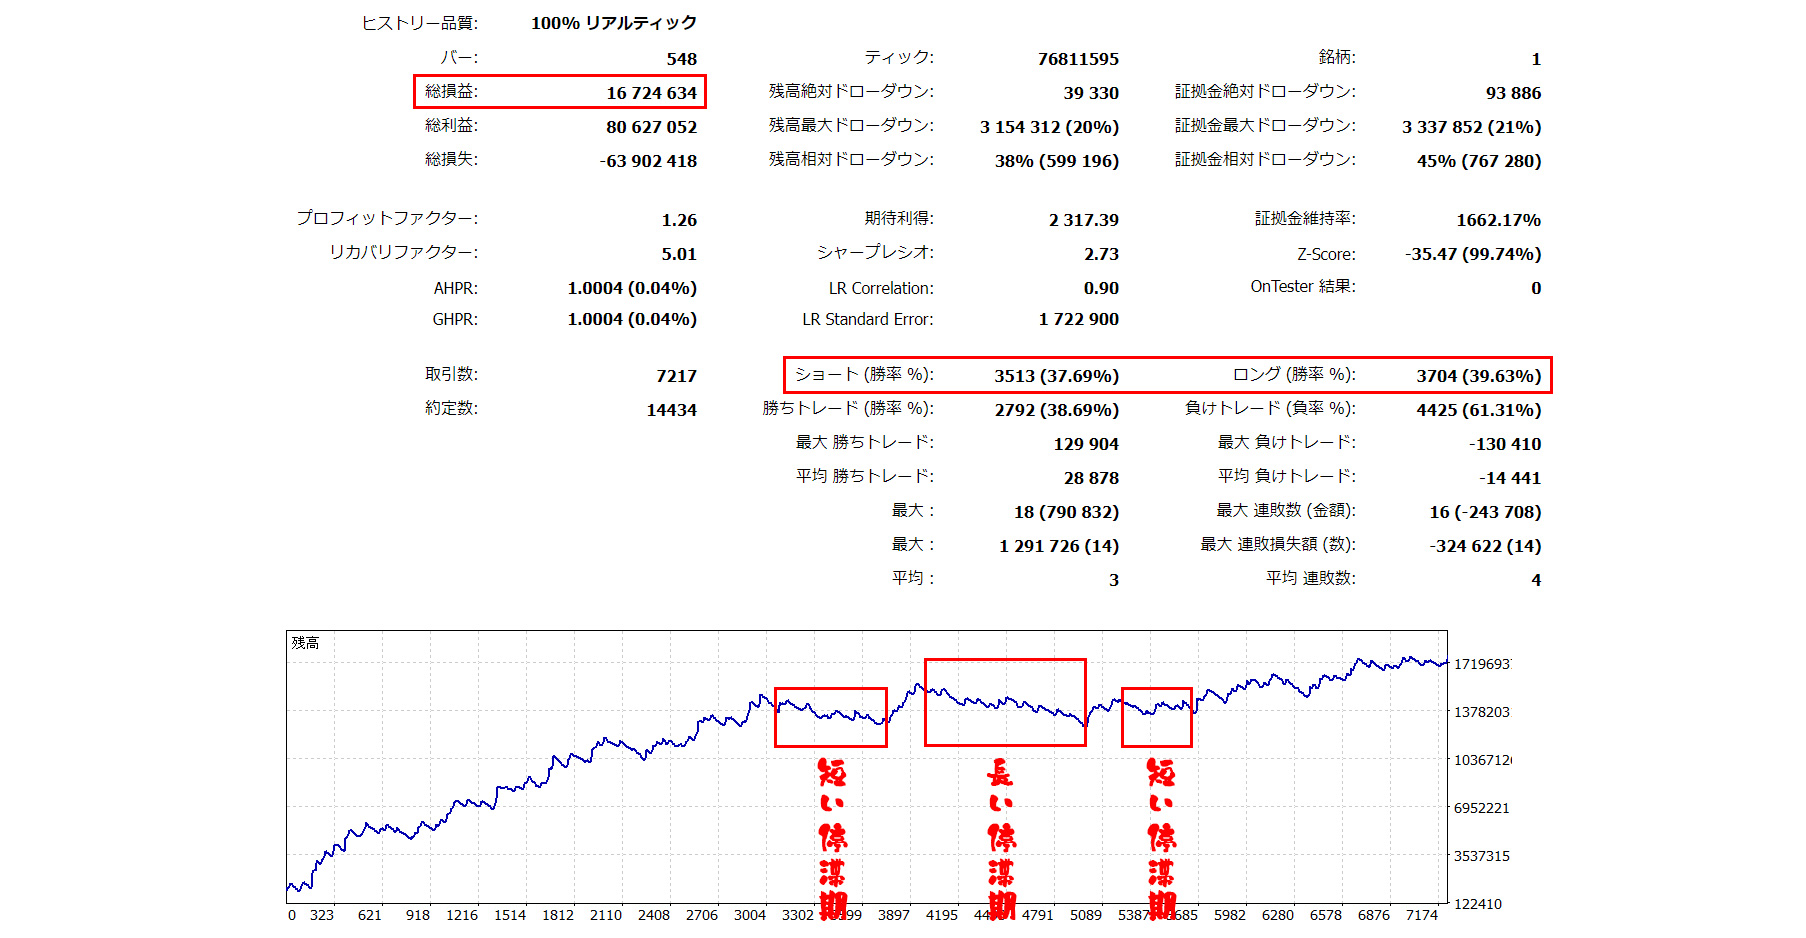
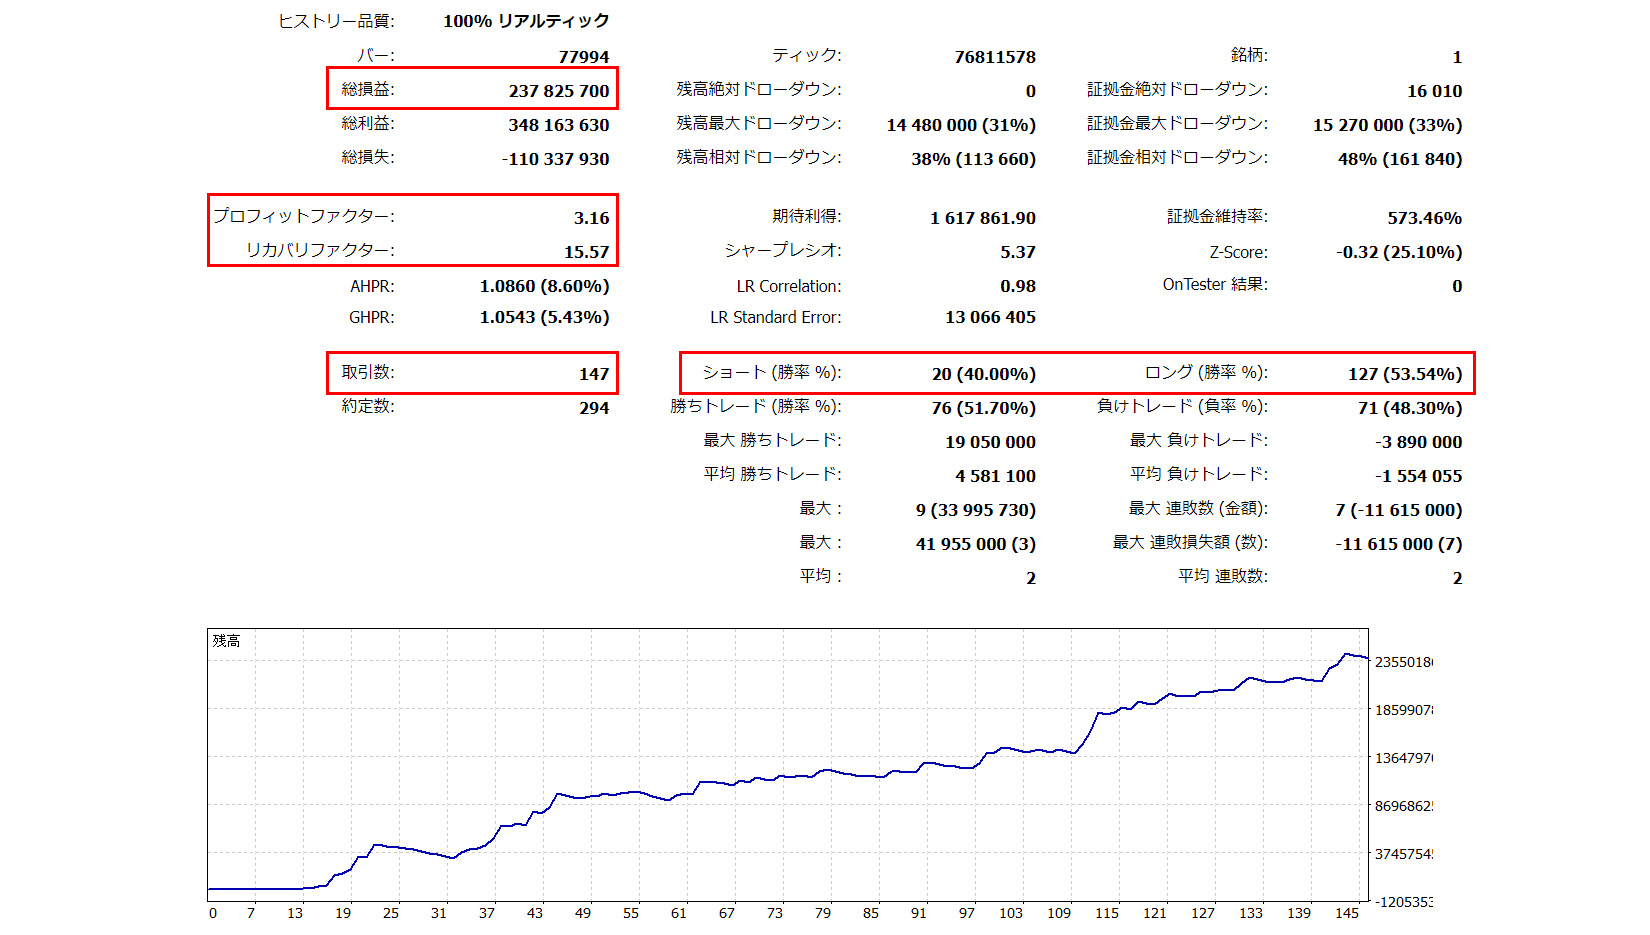
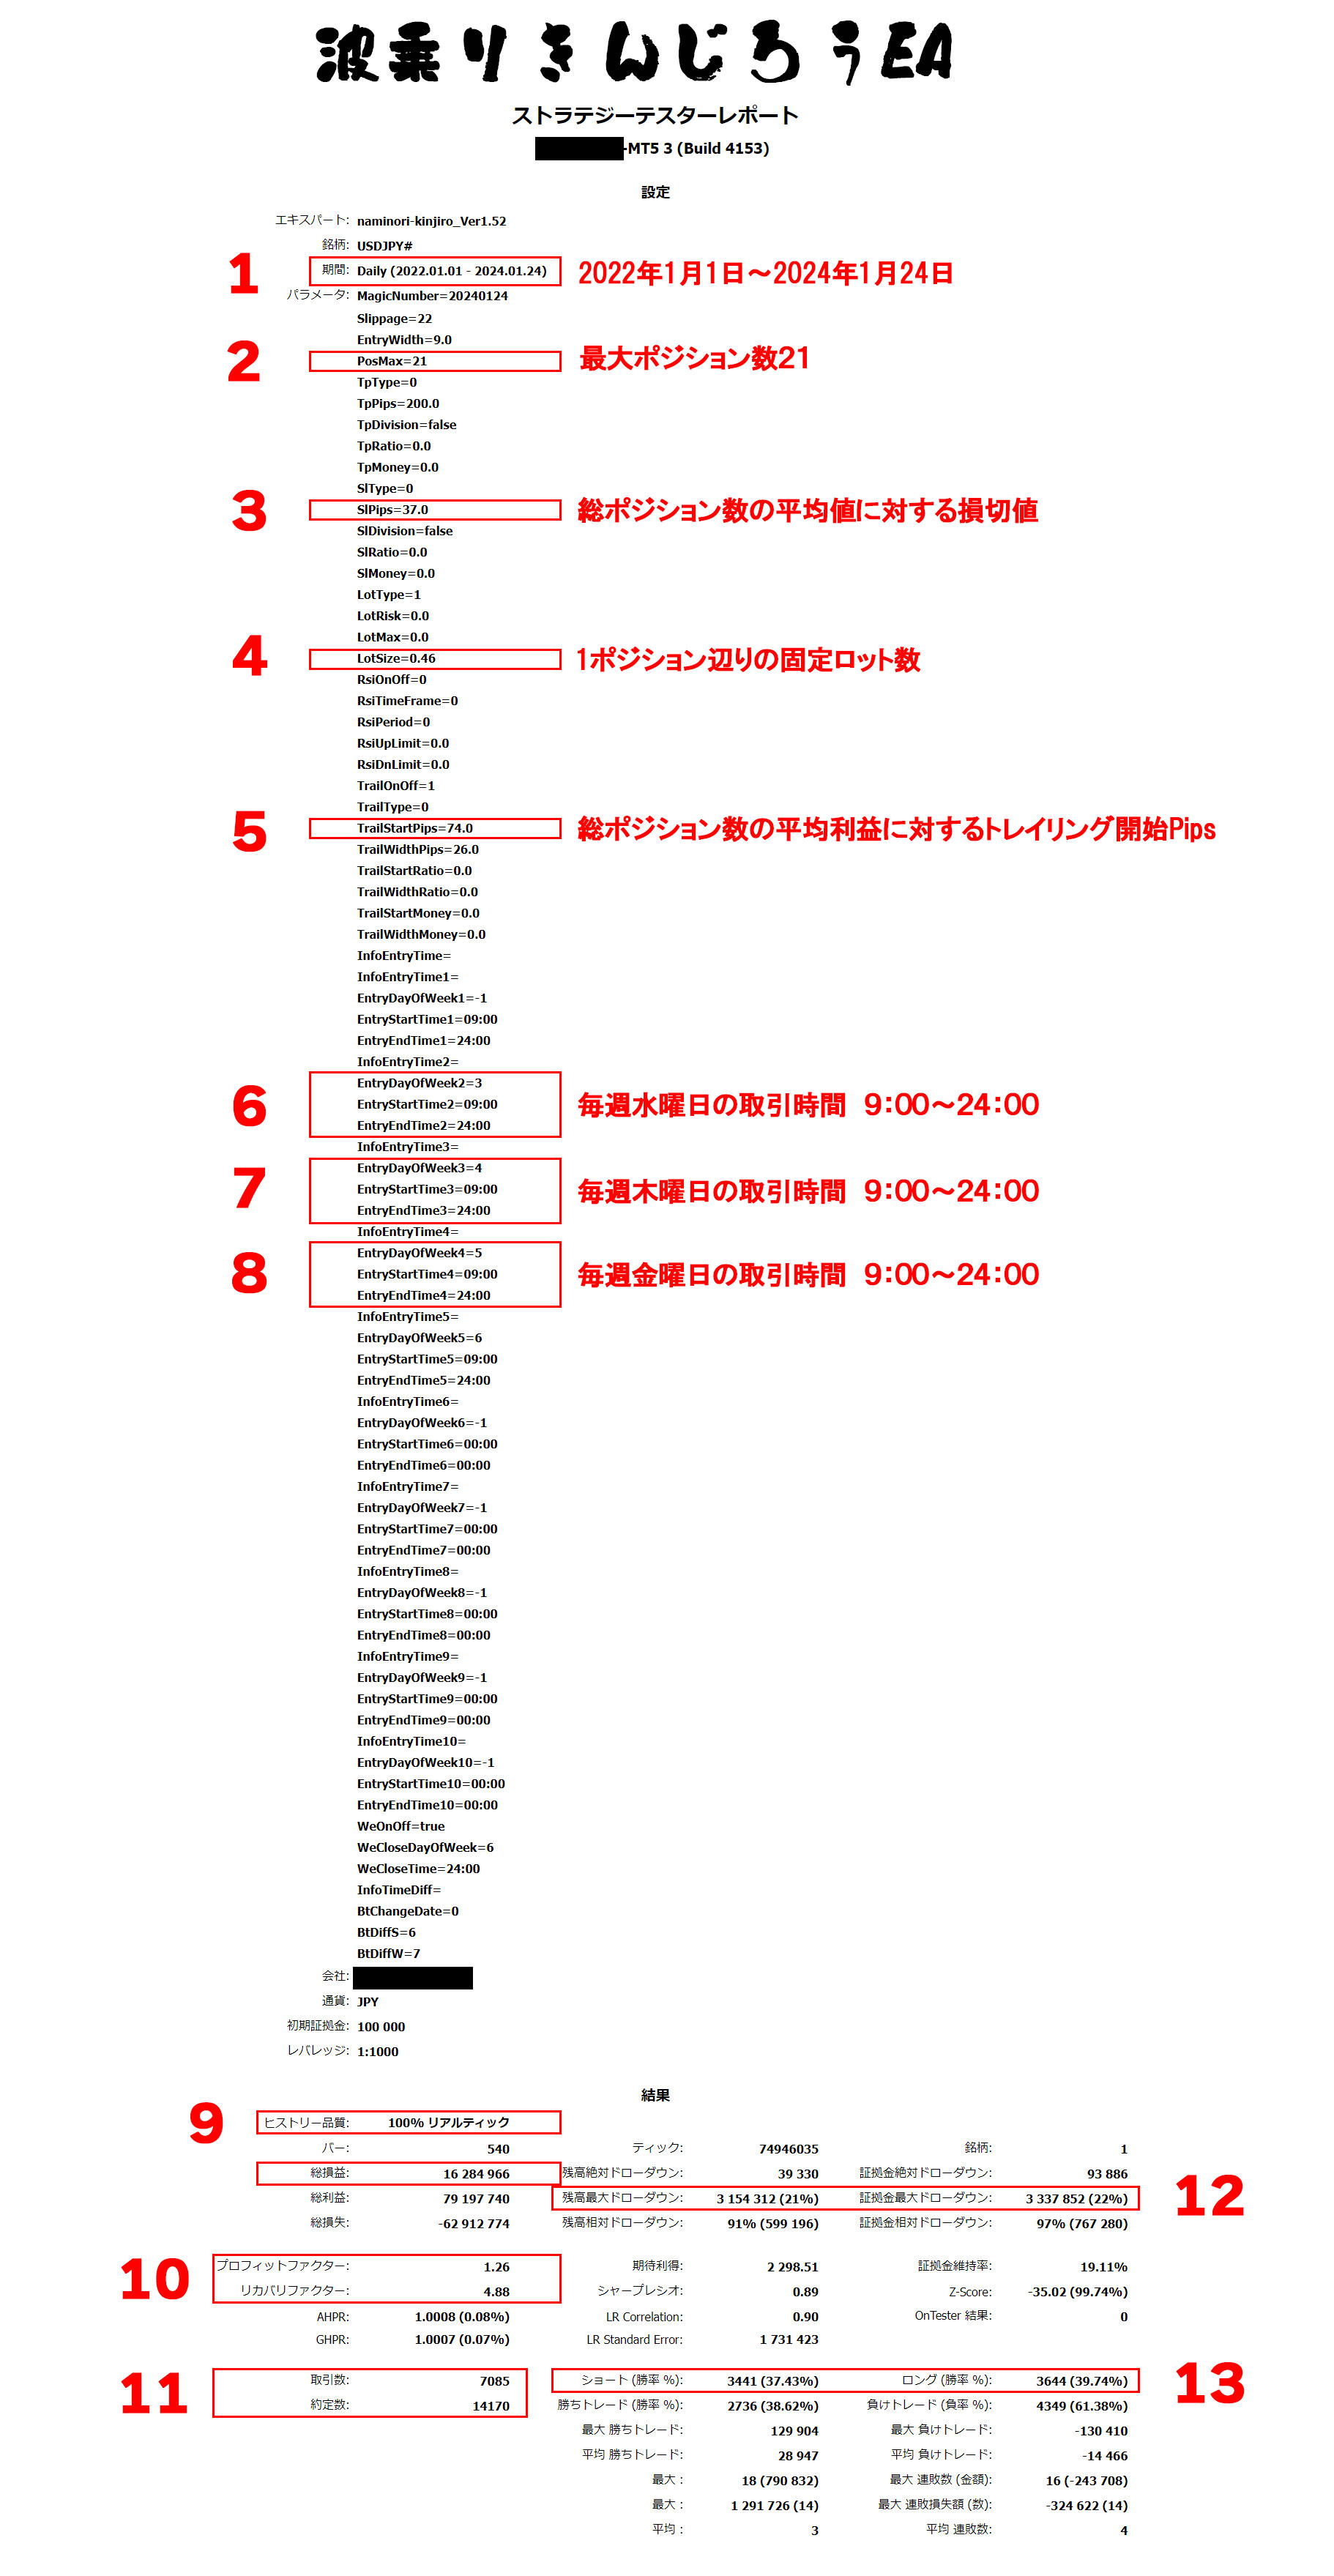
Here is the MT5 real-time backtest result for Kinjiro over the most recent two years.
With a fixed lot of 0.46, 100,000 yen grew to over 16,000,000 yen in two years.
In a domestic brokerage account, that would be roughly 1,600,000,000 yen.
I will explain in order, but before that, from the failures of Super Recovery, one major lesson is that one of the primary reasons for large losses in range-bound markets is the auto-lot feature.
Therefore Kinjiro uses a fixed lot size this time.
- Test period: January 1, 2022 to January 24, 2024 (2 years)
- Longs and shorts combined up to 21 positions as the upper limit
- Stop loss
- Fixed lot size
- Trailing start
- Trading starts on Wednesdays
- Thursdays
- Only three days per week on Fridays
- Tick-based historical data
- PF 1.26 RF 4.88
- 7,085 entries over two years
- Drawdown 22% is acceptable
- The win rate is very low because when a position closes, it always starts from hedged positions, so several stop-outs occur at each closure
The logic that adds positions only in the direction with unrealized gains creates this relatively low win rate.
And my interest is not win rate but how much total profit can be generated in a short period, so I tend to favor high-profit, low-win EA.
Also, while Super Recovery uses trend-based MA on a 4-hour basis, Kinjiro builds its logic purely on price action without using indicators, oscillators, or candlesticks, which is a major difference from the new work.
Backtests show a maximum of 0.46 lots.
With high leverage and 100,000 yen initial capital, 0.46 lots × 21 positions equals 9.66 lots as the maximum holding lot size.
Kinjiro’s main feature is that there are often unrealized gains, allowing many positions to be held even with limited capital.
Of course, this is with high leverage.
In domestic accounts, it would be prudent to keep the lot size around one-tenth, or increase initial investment to around 1,000,000 yen.
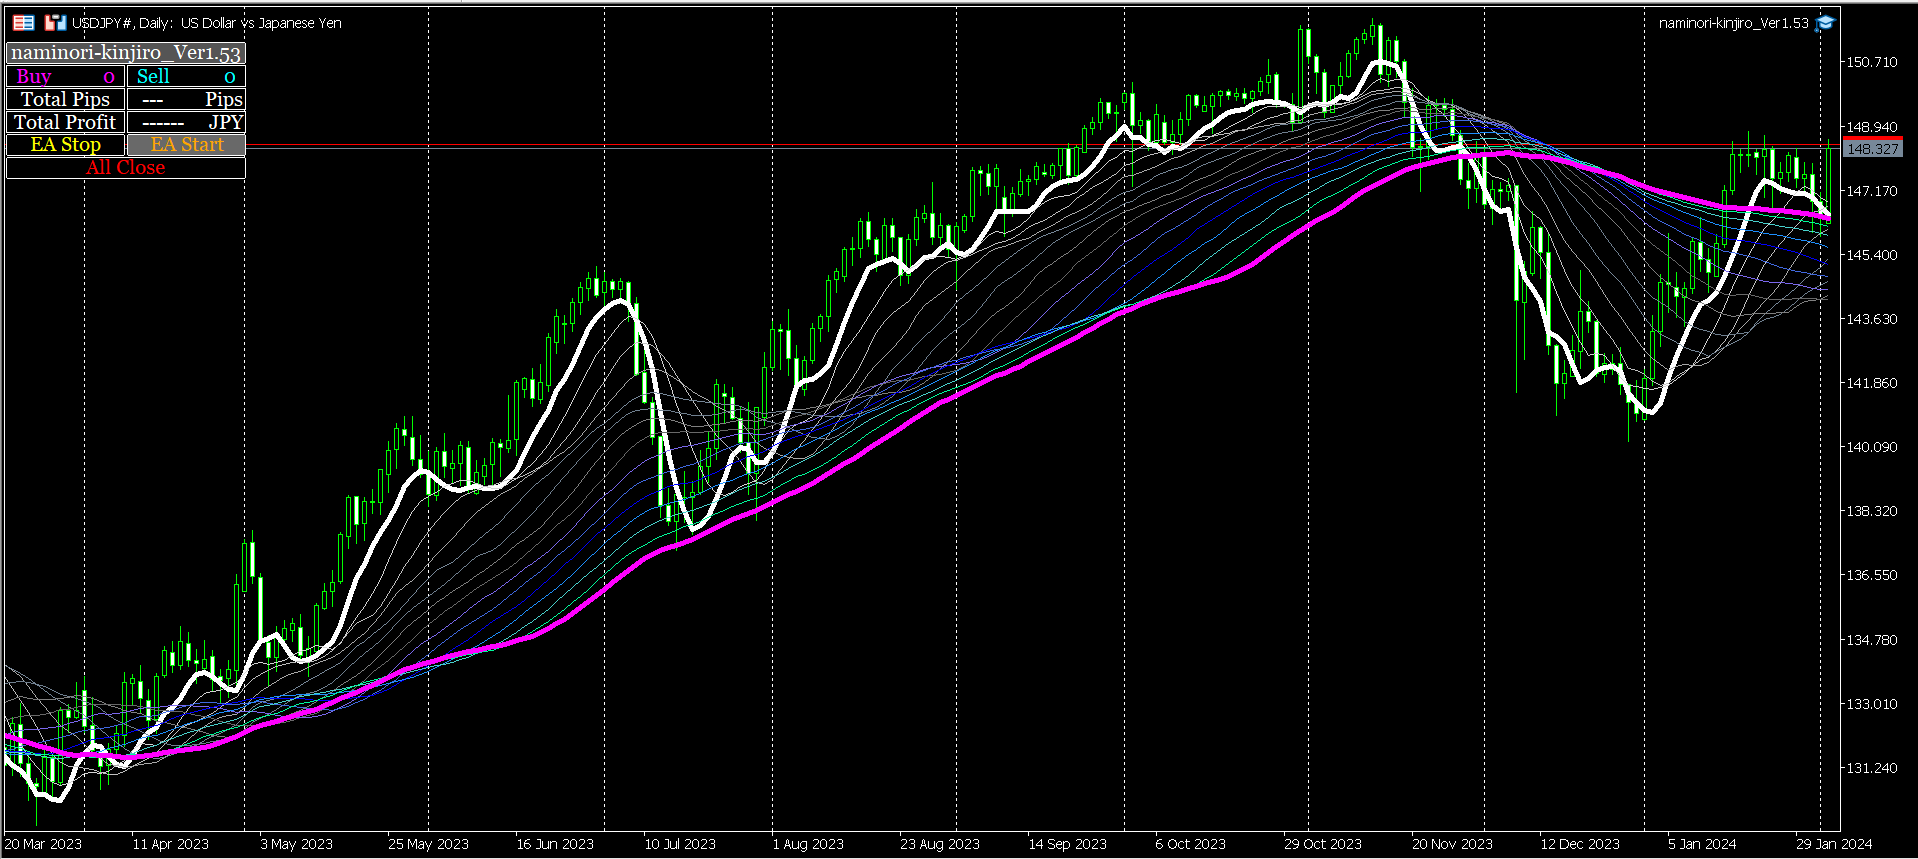
Super Recovery’s main entry logic uses the Recovery indicator and only entries in the same direction on the 6-minute timeframe after a confirming 4-hour MA trend signal, whereas Kinjiro centers its logic on price action, making timeframes irrelevant and simply using price in pips to implement a grid method.
What does this mean? The grid is the default grid displayed when MT5 is installed.
It refers to a method of repeating entries at equal intervals.
The grid is composed of vertical and horizontal dashed lines in a grid pattern.
As shown in the figure, by default the grid is displayed in 22 pips increments, depending on the timeframe.
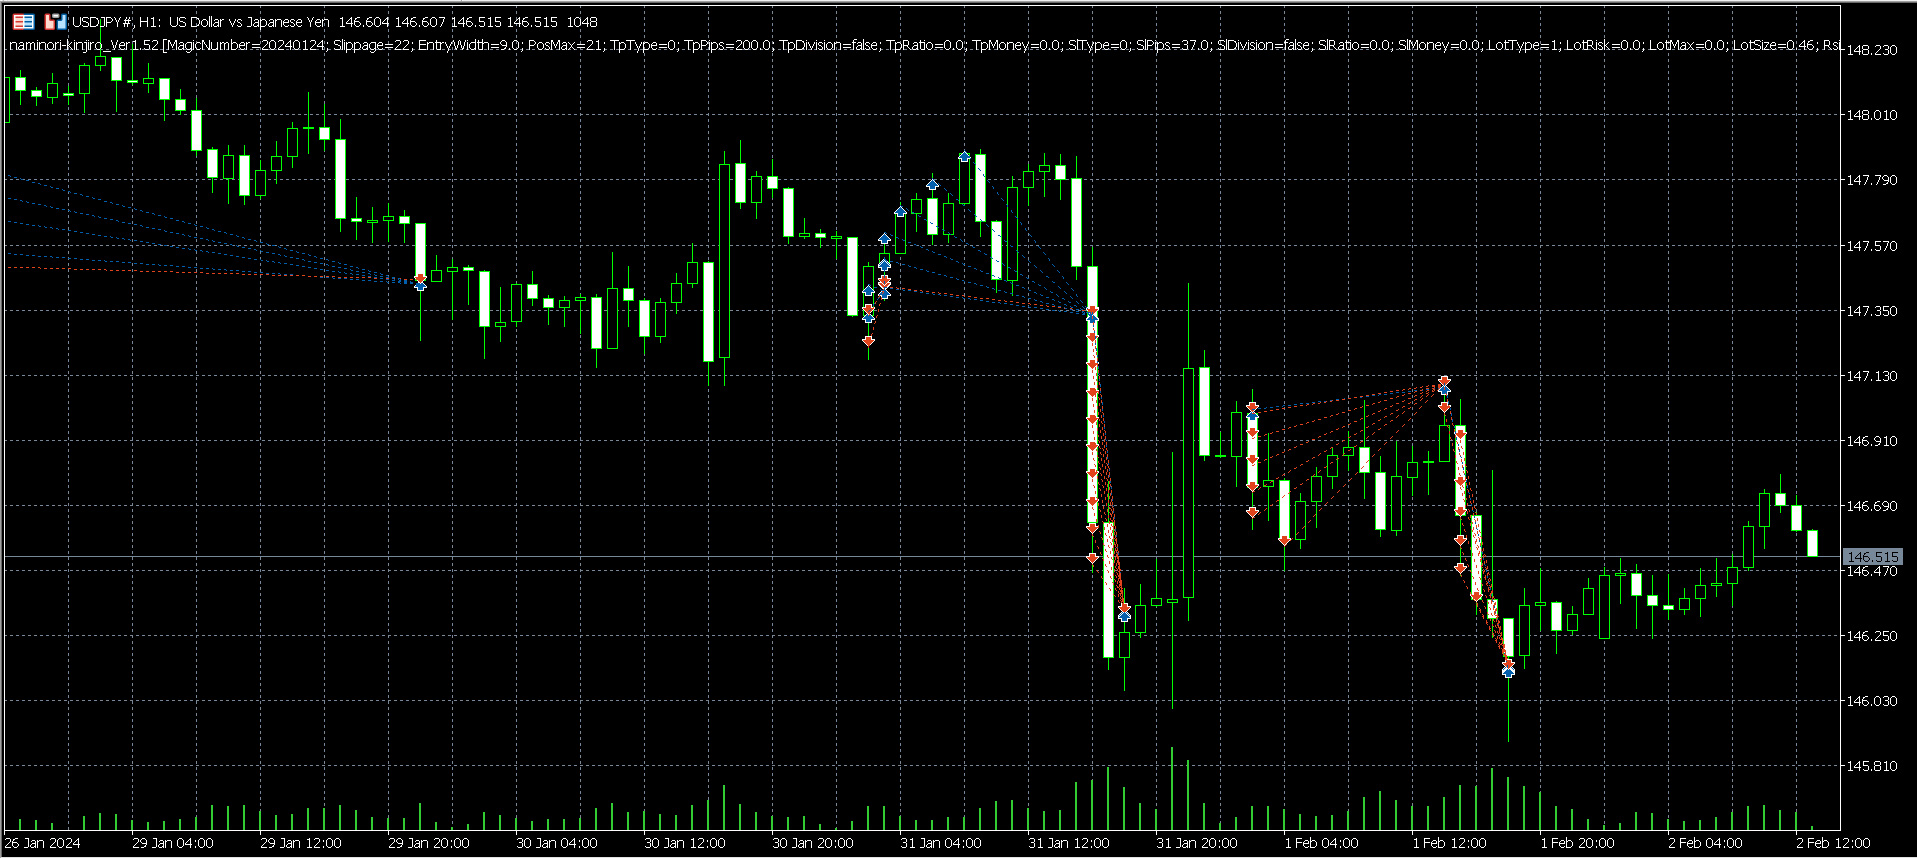
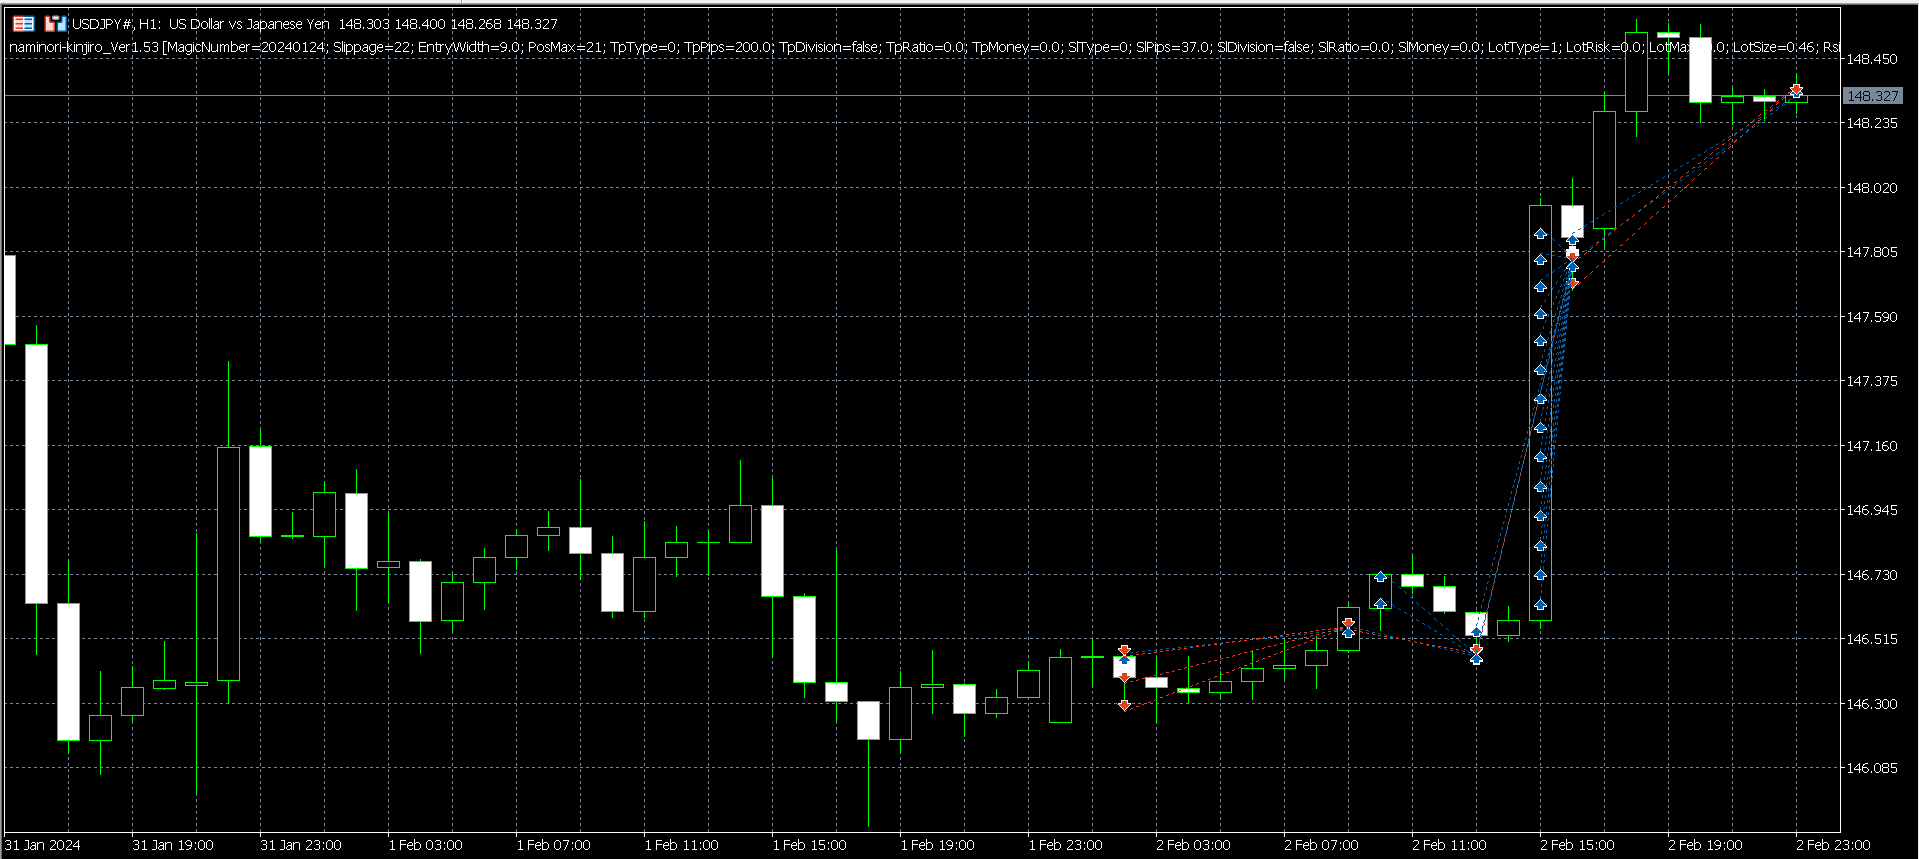
The above shows Kinjiro’s trading history for this week.
The grid is set at 9 pips.
In other words, it is a method of continuously adding positions in the direction with unrealized gains by 9 pips at a time, pyramiding.
The trading history during large downward moves on the chart illustrates Kinjiro’s characteristics, and this capacity to quickly enter positions at times of important statements or data releases is because the logic focuses solely on price action.
Using the grid to add positions at 9 pips increments, pyramiding only in the direction with unrealized gains.
In short, a scalping-based pyramiding method.
Regardless of the exact logic, my basic principle is trend-following and adding in the direction of the trend, so I again chose a pyramiding approach for Kinjiro as with Super Recovery.
That is the only point where Kinjiro and Super Recovery share a commonality.
Why insist on pyramiding? Because of painful experiences with mean-reversion averaging-down (martingale) strategies.
Mean-reversion averaging-down strategy adds positions in the direction of losses, which is the essence of averaging-down and martingale.
When adding positions in the direction of unrealized gains, it is called pyramiding.

Kinjiro starts from hedged positions immediately after the EA is installed.
Trading begins with a 1:1 ratio of long and short positions.
When the EA starts, both long and short entries occur at the same time, fixing both potential profits and losses initially.
If the price rises by 9 pips, one long position is added.
Each time the price rises by 9 pips thereafter, one more long position is pyramided.
If the market reverses and falls 9 pips below the initial short position and the short positions become unrealized gains, one short position is added.
At that moment, all the initial long positions become unrealized losses, and the previously unrealized short positions turn into unrealized gains.
Thereafter, entries continue only in the direction with unrealized gains, up to a maximum of 21 positions.
If, for example, at the time of reaching the maximum 21 positions there are 3 shorts and 18 longs and the price continues to rise, large profits occur while the 3 short positions become unrealized losses.
If the market moves opposite to many positions, it results in a stop-out.
The imbalance between unrealized losses and gains, and the trend continuing in the larger-position direction, leads to substantial profits and an expanding total profit and loss.
There was a drop of about 200 pips in the shadowed area in the image above.
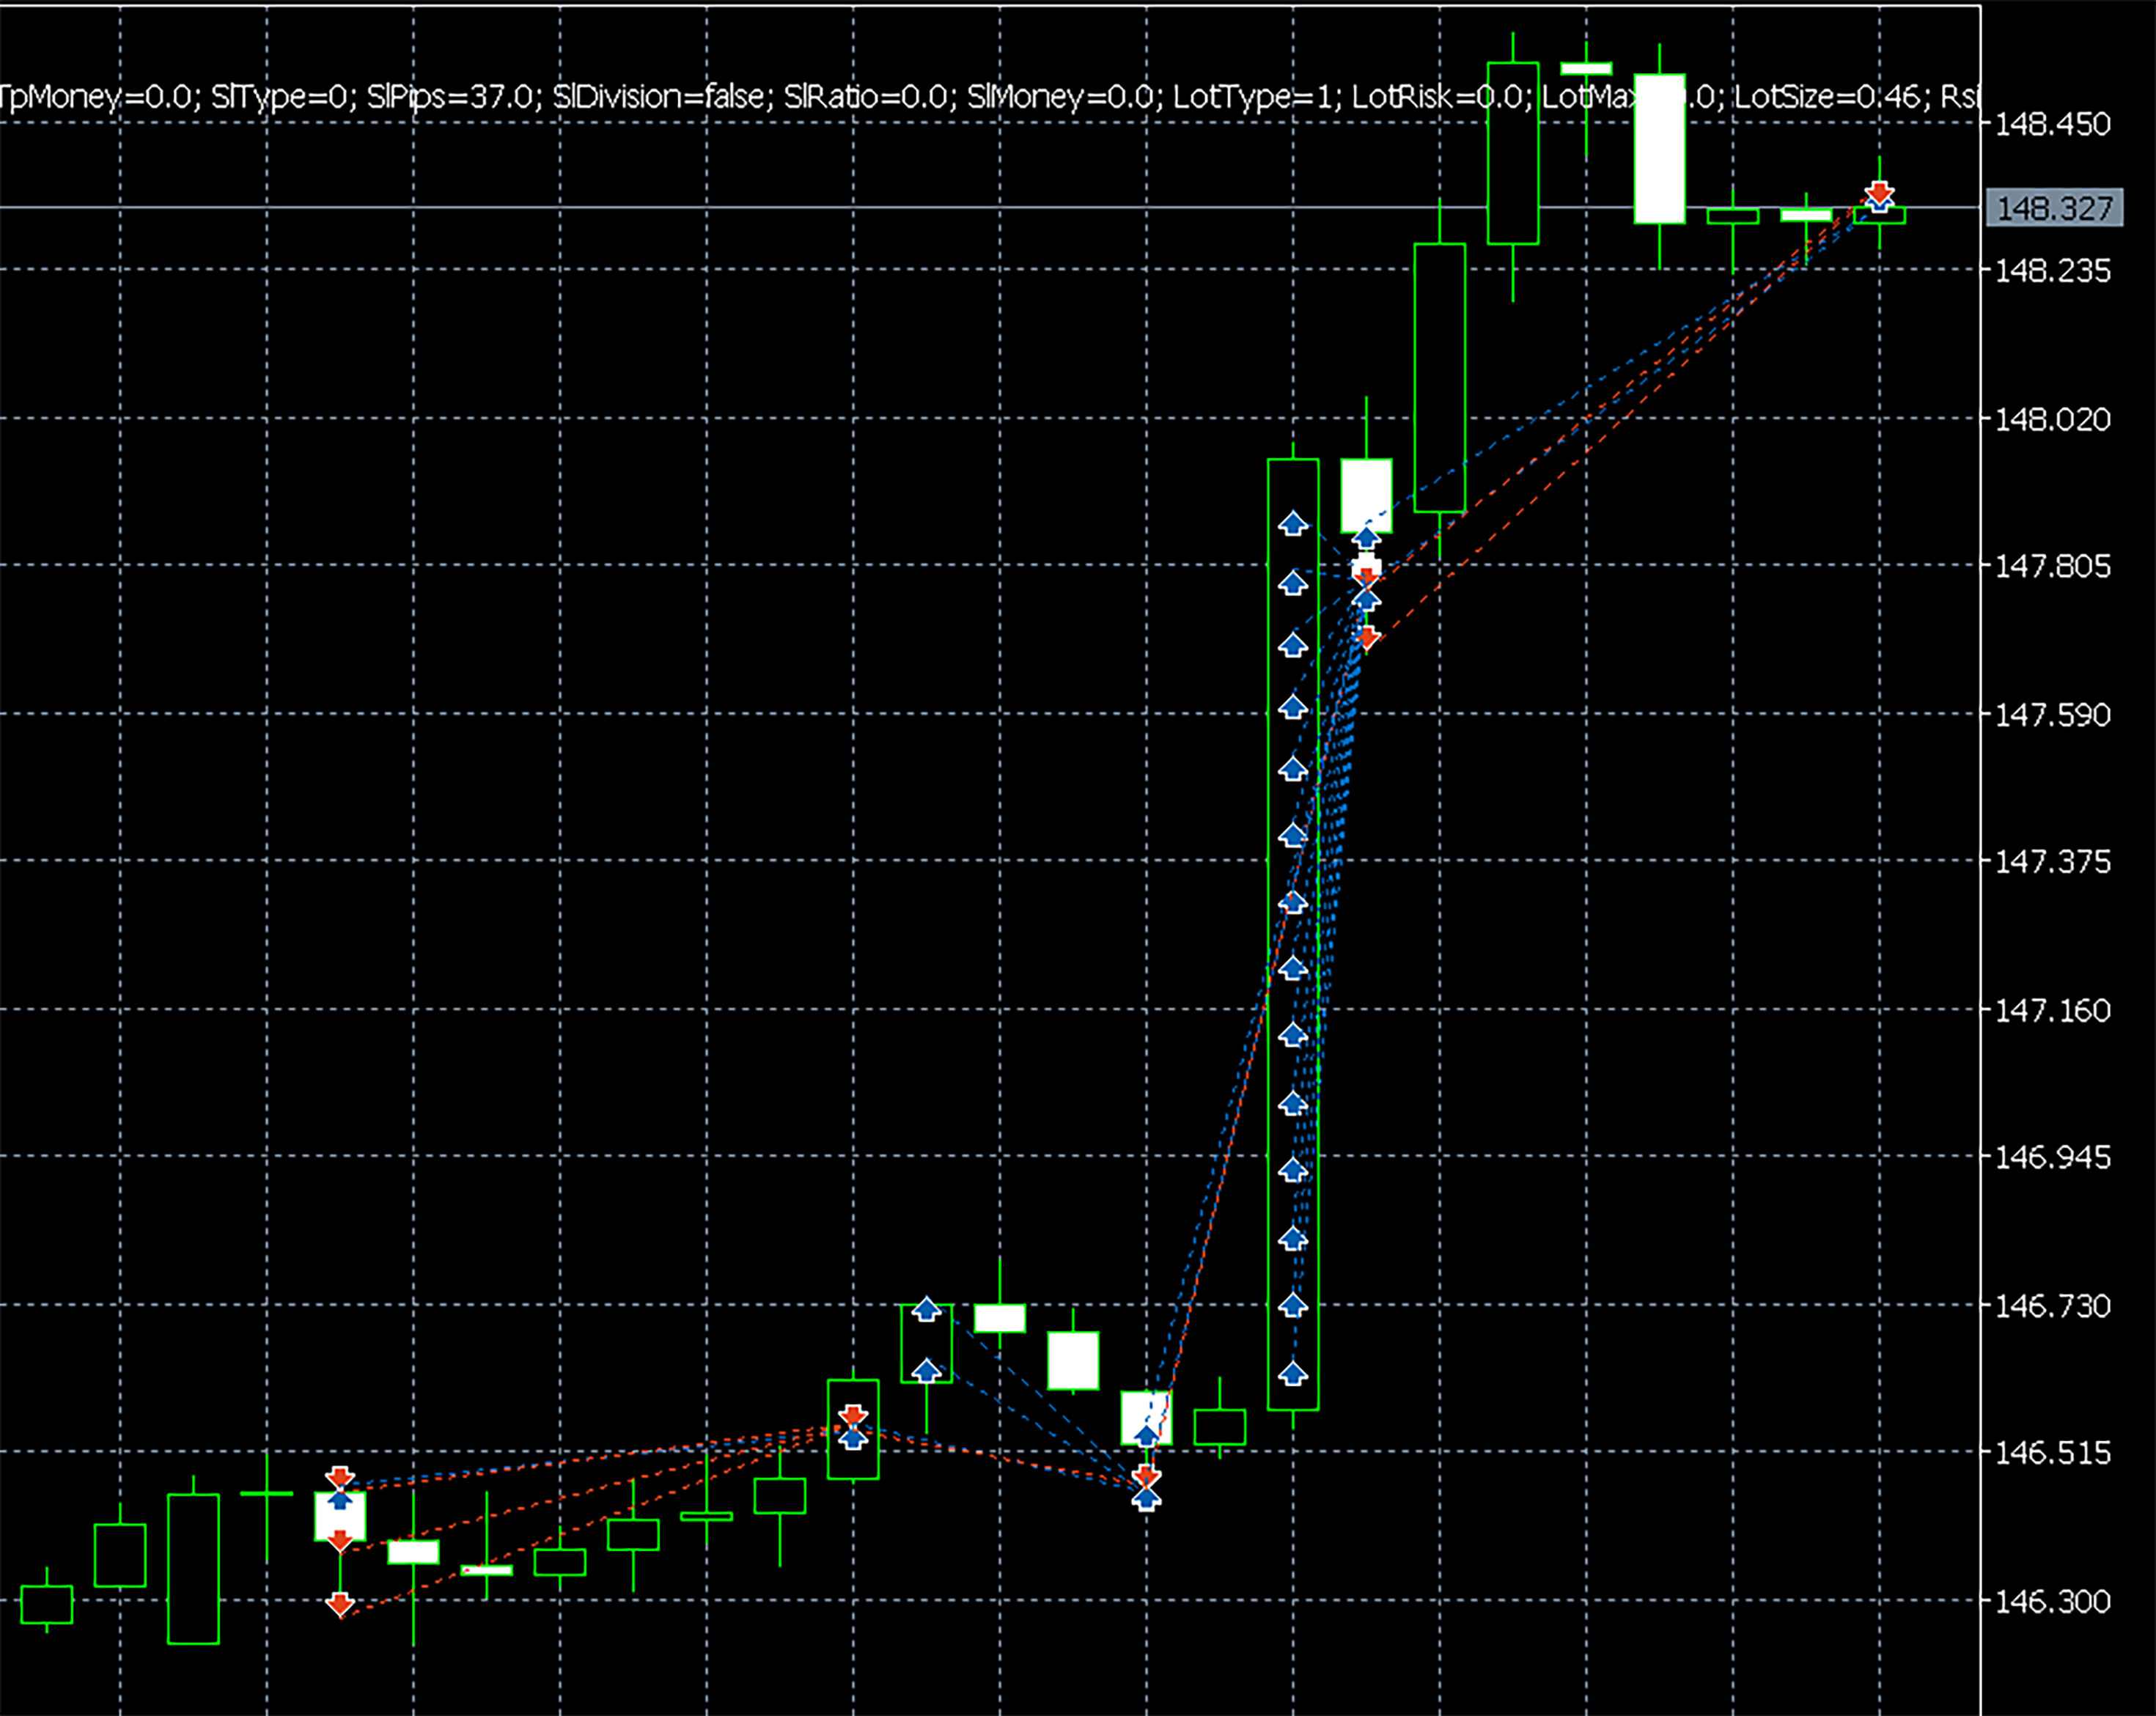
Let's zoom in on the same scene below.
The magnified hourly USD/JPY movement for February 1–2 of this year shows entries repeated at 9-pip intervals in the direction with unrealized gains.
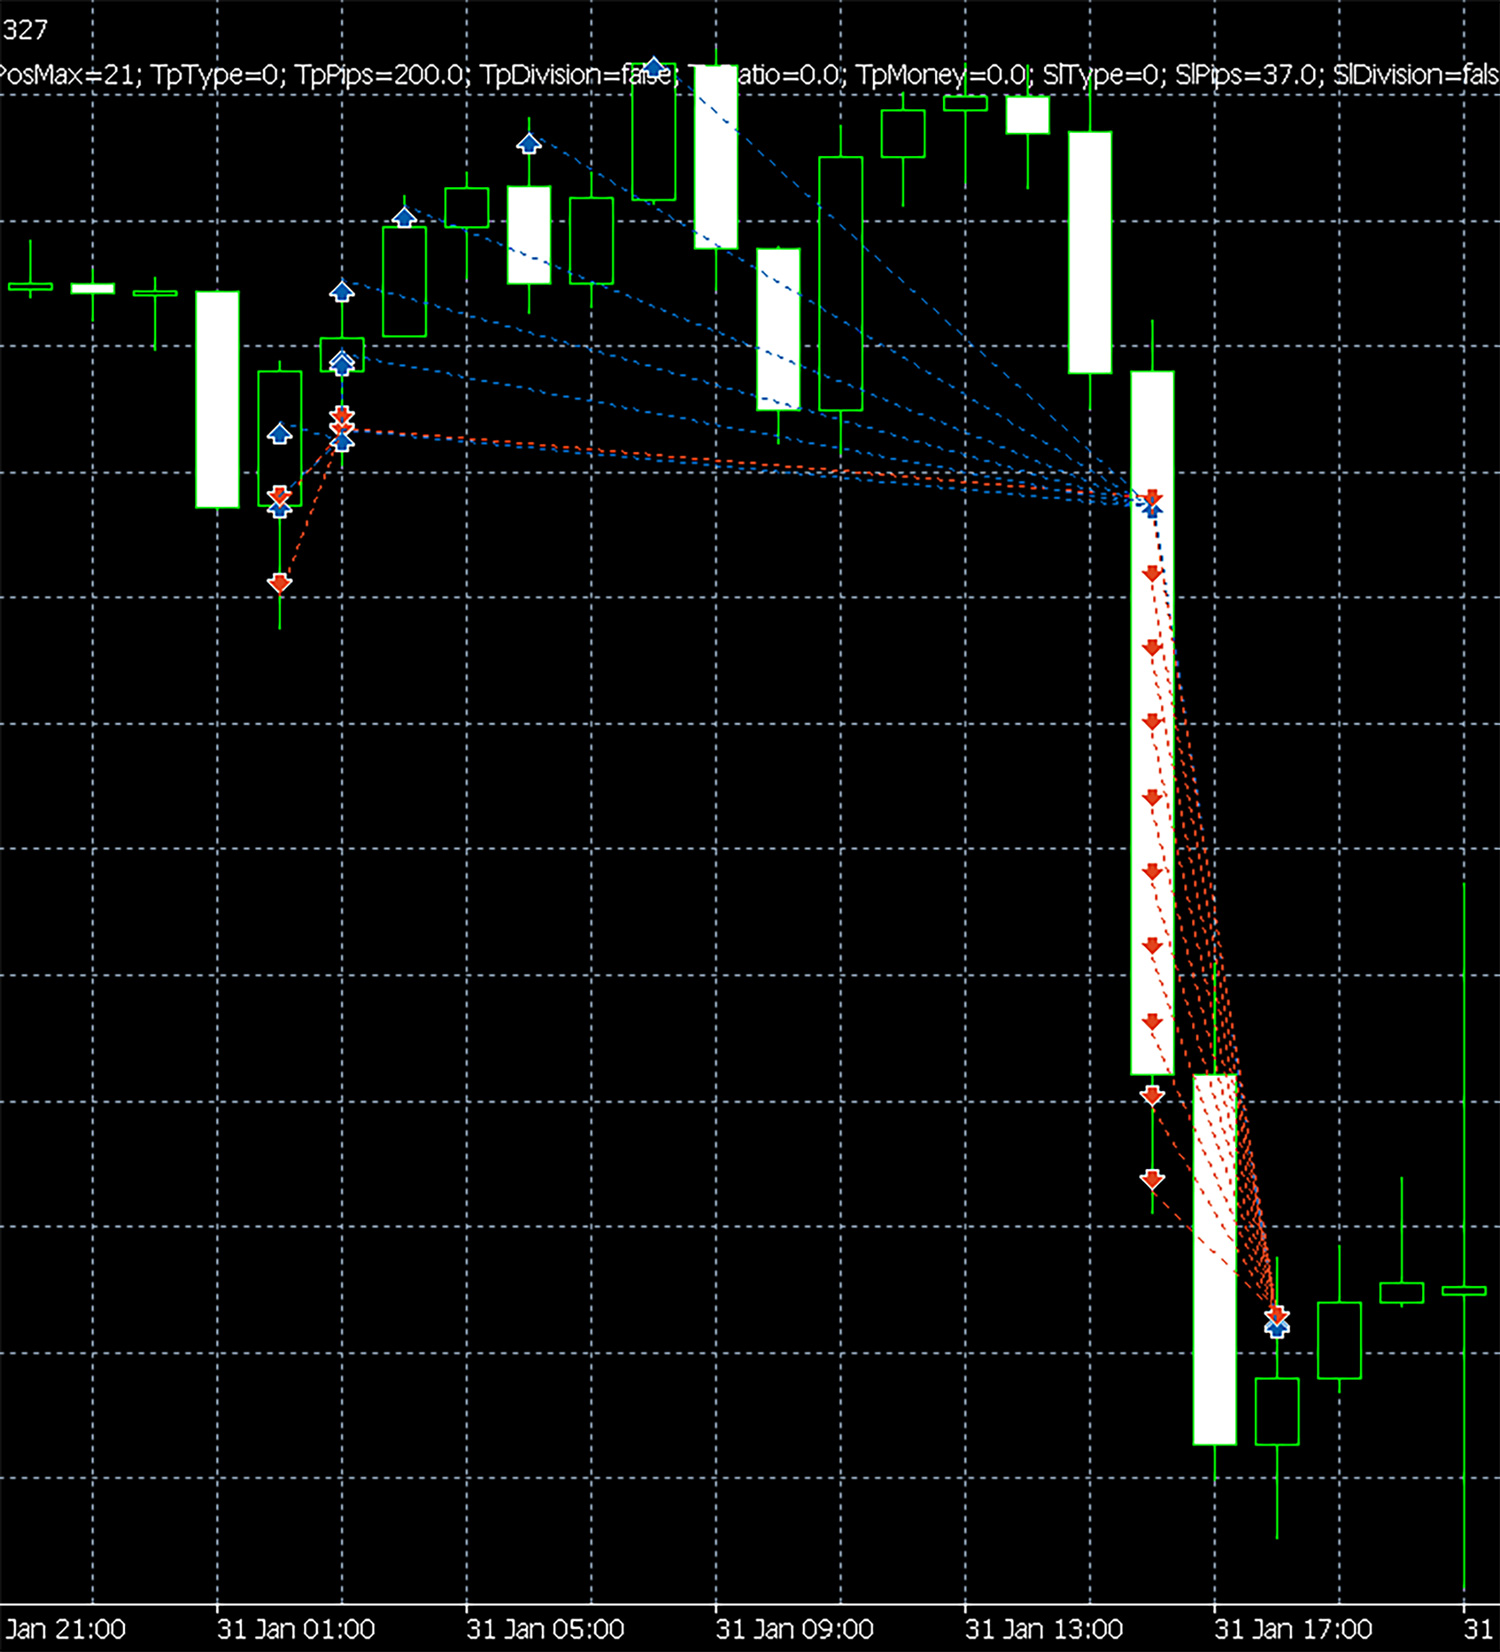
As shown above, Kinjiro pyramids positions at 9 pips increments, but large price movements cause slippage and entries are not made at perfectly equal intervals.
As a rough guide, the price-action-based position acquisition method uses 9-pip grid only.
On the left side of the figure, longs are stopped out; in the center to the right, large profits are produced from shorts.
As a result, this day ends with a substantial net gain because gains exceed stop-outs.
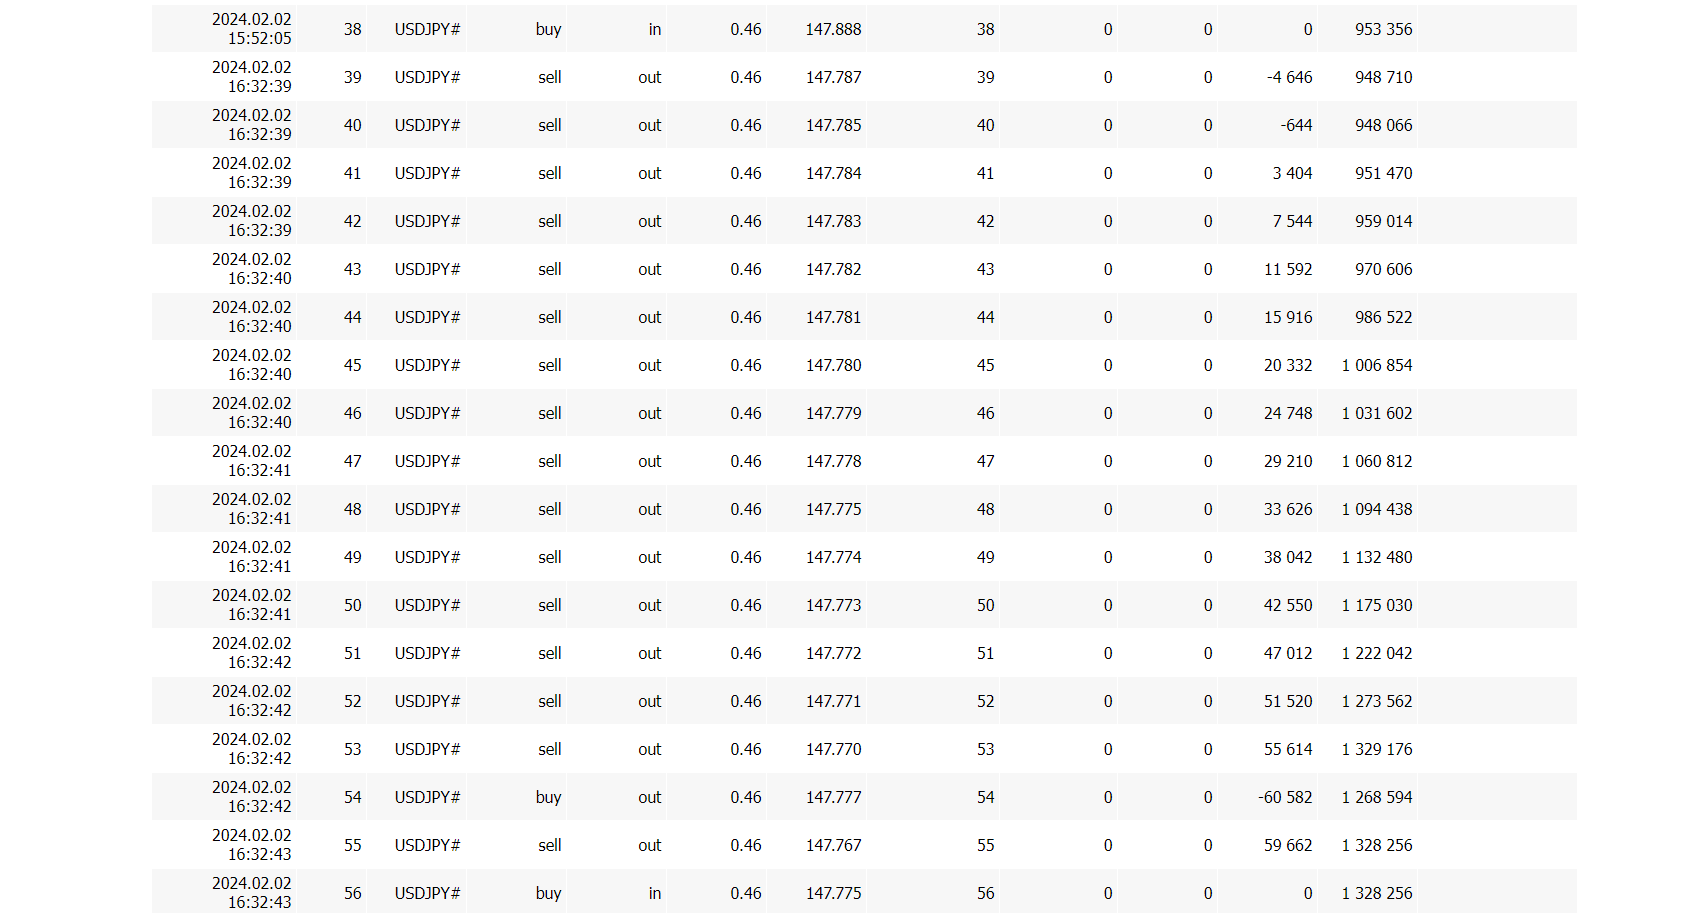
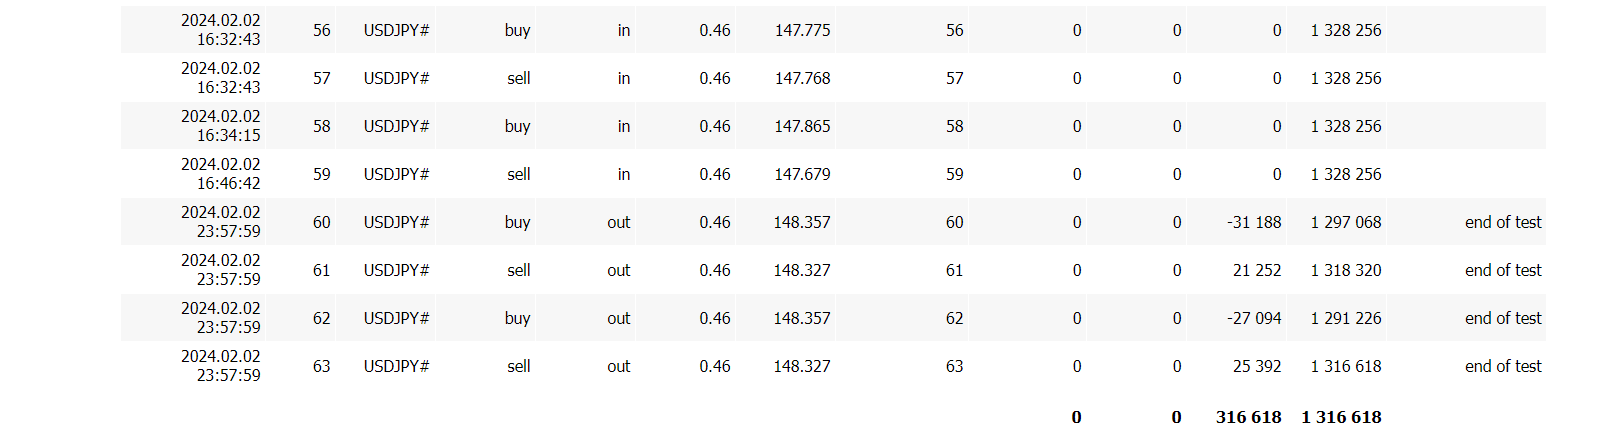
February 2’s trading history is shown here.
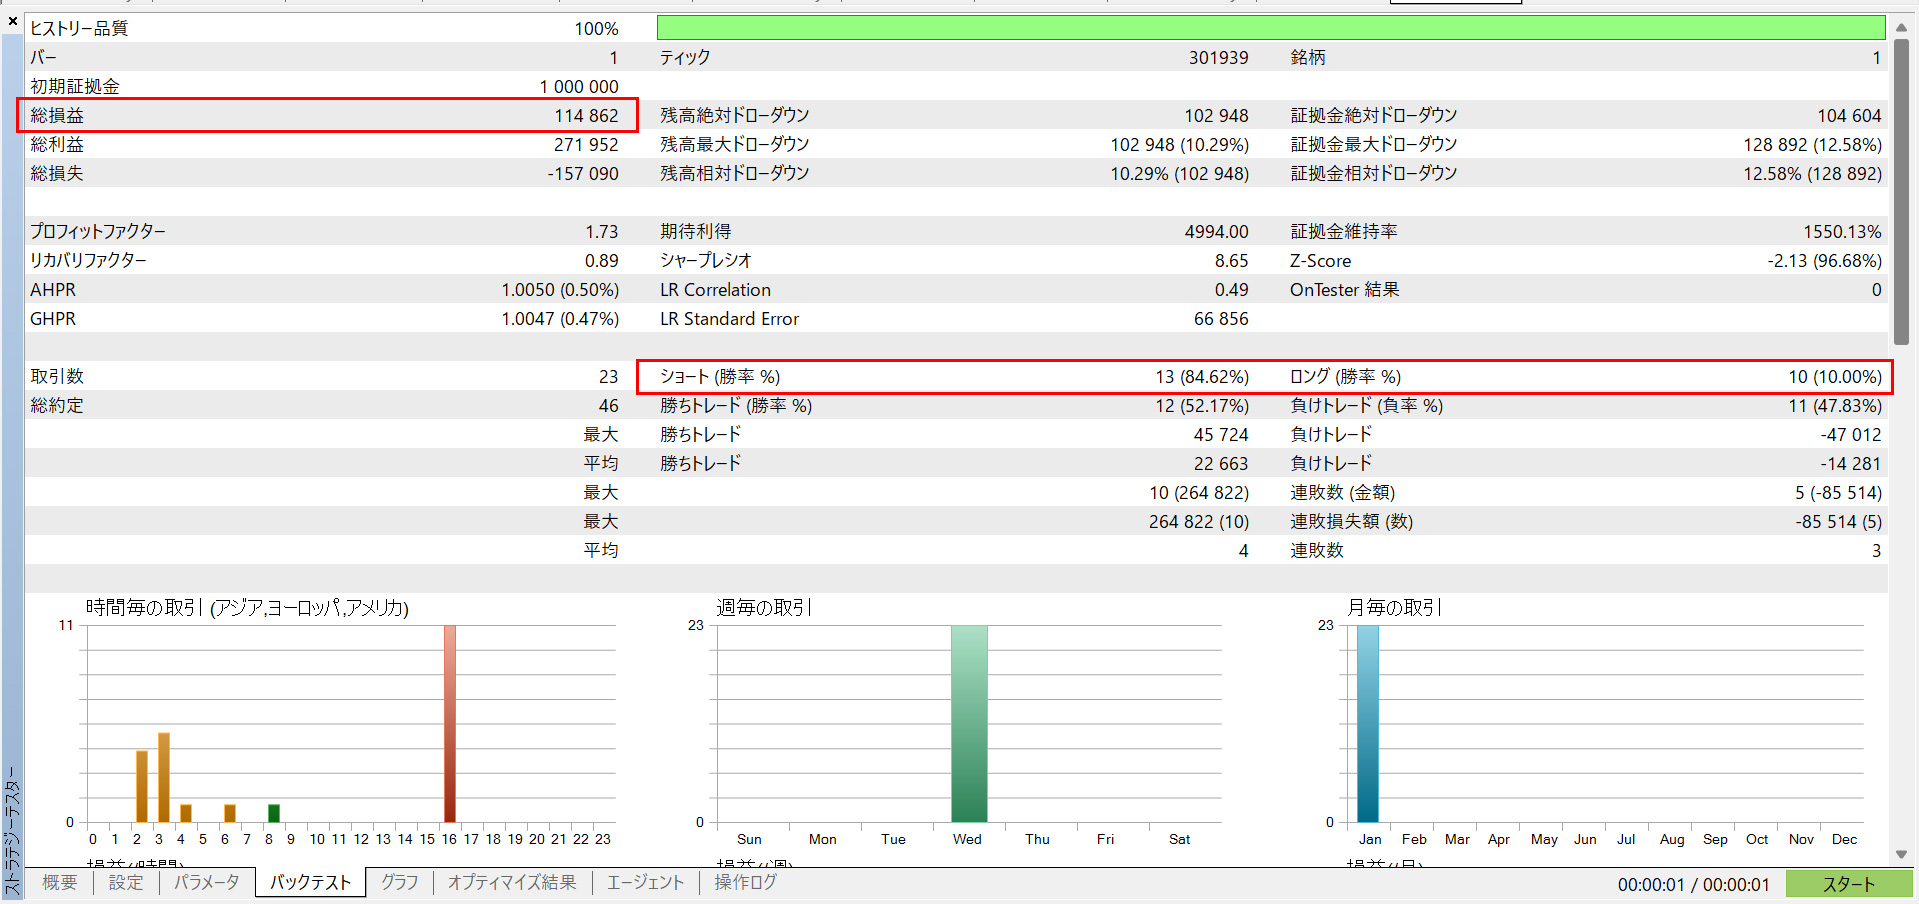
With an initial margin of 1,000,000 yen, daily profit was 114%, making total profit and loss 114,862 yen.
Thus, regardless of which time frame the EA is used on, Kinjiro’s unique logic remains unaffected.
Whether installed on a 1-minute or a daily chart, entries occur at 9-pip increments.
I will write the continuation tomorrow.
Today is February 3, calendar date changed.
I have just eaten an ehomaki.
According to Google AI...