
The 6th session: How to narrow the price range of the area to the permissible range [FX Planner]

In the previous article, we learned how to enter by attracting and entering when the range of the area is larger than the acceptable range. This time, with a different perspective, I will teach you a method to narrow the area to your own acceptable range, enabling easier entries.
【The Essence of the Area Method Practical Edition [FX Planner]】
・Episode 1: How to find high-advantage areas from the chart(Free公開)
・Episode 2: Thoroughly analyze the chart from candlesticks
・Episode 3: Thoroughly analyze the chart from candlesticks ~ Area Method Explanation ~
・Episode 4: How to think about and set the acceptable range
・Episode 5: How to use the set acceptable range with the Area Method
・Episode 6: The way to narrow the width of the area to the acceptable range
・Episode 7: What to do before and after entry
・Episode 8: Area adjustment and decision criteria
【Related Articles】
・The Essence of Technical Analysis | Episode 1: Grasp the psychology of buyers and sellers [FX Planner]
Episode 6 Table of Contents
1. Narrowing from the long-term to the short-term
2. Waiting for the formation of a long-area on the short-term chart
3. A breakout above the short-area triggers the entry
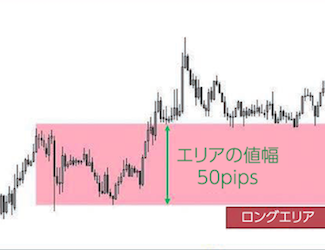
Narrowing from the long-term to the short-term
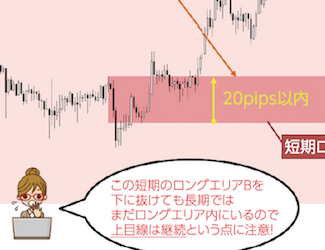
In the previous article, I mentioned that when the width of the area exceeds the acceptable range, you should base it on the stop-loss line and “pull it to the acceptable range.” This time, I want to look at another approach: narrowing the area width to the acceptable range.
This approach requires multiple timeframes. While the method of analyzing the chart does not change with timeframes, the wave size and the width of the area can vary significantly. Use this property to narrow the width. The wider the area width is, the larger the timeframe, the more likely the acceptable range will be exceeded if the acceptable range is small. So how should you approach the long-term area?