
The 2nd Session: Thoroughly Analyzing Charts from Candlesticks [FX Planner]
In the first article, we learned an overview of the area method for finding high-probability locations within a chart. So, in practice, how should we analyze a chart that uses only candlesticks, and how should we approach it? I will explain concretely.
[The Secrets of the Area Method: Practical Edition [FX Planner]]
・第1回 How to find high-probability areas within the chart(Free release)
・第2回 Thoroughly analyze the chart from candlesticks
・第3回 Thoroughly analyze the chart from candlesticks ~area method explanation~
・第4回 Concept and determination of acceptable range
・第5回 How to use the set acceptable range with the area method
・第6回 How to narrow the range of the area to the acceptable range
・第7回 What to do before and after entry
・第8回 Area revisions and decision criteria
【Related Articles】
・The Secrets of Technical Analysis|Vol.1 Grasp the psychology of buyers and sellers[FX Planner]
Table of contents for Part 2
1. Determine support and resistance from candlestick movements
2. Focus on why candlesticks form
3. Point 1|Who is moving the market
4. Point 2|All investors do not want to be the ones to lose
5. Point 3|A position of advantage and a place you don’t want to be penetrated
Determining support and resistance from candlestick movements
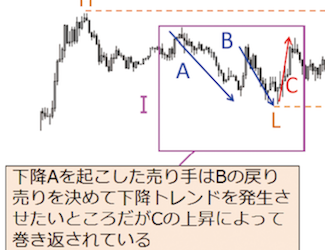
In the last installment, we told you that the chart should be analyzed using only candlesticks with the area method, and this time I would like to discuss specifically how to analyze it. The single most important purpose of the area method can be summed up as: to identify a more accurate support and resistance from candlestick movements.
This isn’t something special; many traders develop their methods using various indicators, but all of it aims to find highly accurate support and resistance. The paths or means may differ, but the ultimate goal is the same.
Because, after all, where the current movement will continue to and where it will reverse? If you could know that 100%, you would never lose in FX. In other words, if you know the 100% reference level of support and resistance, your winning rate would be 100%.
However, realistically that 100% is impossible, so the idea is to pursue higher accuracy. And at FX Planner, we determine this only by the movement of candlesticks.