
How to Find High-Priority Areas on the Chart [FX Planner]
In the previous FX Planner series “The Essentials of Technical Analysis,” we learned a way to capture the psychology of buyers and sellers in the foreign exchange market. In this new series “Practical Edition of the Area Method Essentials,” FX Planner will lecture you on the original technical method based on that concept—the Area Method!
【The Essentials of the Area Method: Practical Edition[FX Planner]】
・Part 1: How to find high-probability areas within the chart(Free to view)
・Part 2: Thoroughly analyzing the chart from candlesticks
・Part 3: Thoroughly analyzing the chart from candlesticks — Area Method Explanation —
・Part 4: How to think about and determine the acceptable range
・Part 5: How to use the established acceptable range with the Area Method
・Part 6: How to narrow the area width to the acceptable range
・Part 7: Things to do before and after entry
・Part 8: Area adjustments and decision criteria
Table of Contents for Part 1
1. Explain the proprietary technical method “Area Method”!
2. The reasons candlesticks alone are sufficient
3. The market is all about support and resistance
4. How to find high-probability edges in the market
Explain the Proprietary Technical Method “Area Method”!
FX Planner uses the Area Method—a proprietary technical approach—to thoroughly analyze charts. By repeatedly trading with this method, he continues to generate profits. Of course, there are losing trades, but by repeatedly taking high-probability trades, total profits accumulate. From this issue onward, we will explain the Area Method.
One of the Area Method’s most distinctive features is that it analyzes charts and makes decisions using only candlesticks, and we will explain how this works.
Why Candlesticks Alone Are Sufficient
Many traders likely display some indicators on their charts. Indicators are used to generate trading signals—that is, to provide reasons to enter. In other words, indicators are placed to justify entry.
But does a candlestick-only chart have no signals? Not at all. FX Planner believes that all information about the market is contained in the candlesticks, and every movement can be explained by them.
Why does the price rise here, why did it fall from there, why does it exhibit sideways movement? The candlesticks provide clear reasons for these movements.
In the Market, Everything Is About Support and Resistance
To win in FX, you either buy low and sell high or sell high and buy back low. To achieve this, you need to find places with a high probability of rising or falling. If you are buying, these are called supports; if you are selling, they are called resistances.
Ultimately, if you could hit 100% accuracy on support and resistance, you would never lose in FX. In other words, FX is a game of predicting where support and resistance will form, or equivalently, where the high and low points will be. However, achieving 100% accuracy is practically impossible.
Therefore, if you can identify places that have even a slight chance of becoming support or resistance, your chances of winning improve. In short, as long as such supports or resistances are depicted on the chart, that is enough.
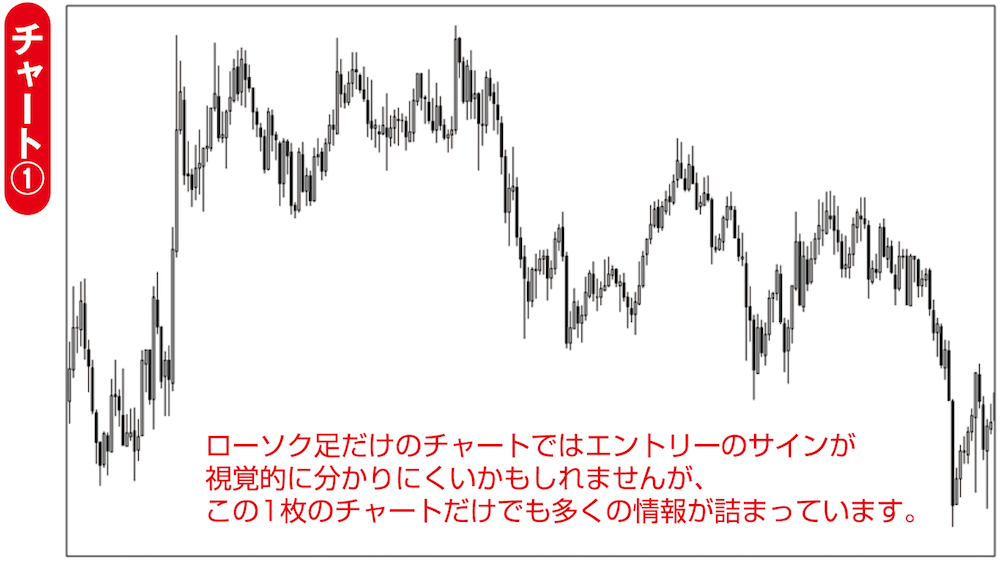
The Area Method focuses on identifying high-probability support and resistance and drawing candidate areas from candlestick movements. Looking at Chart A, candlesticks alone may look dry, but by drawing support and resistance inside the chart as in Chart B, entry candidates become visualized and trades can be executed with confidence.
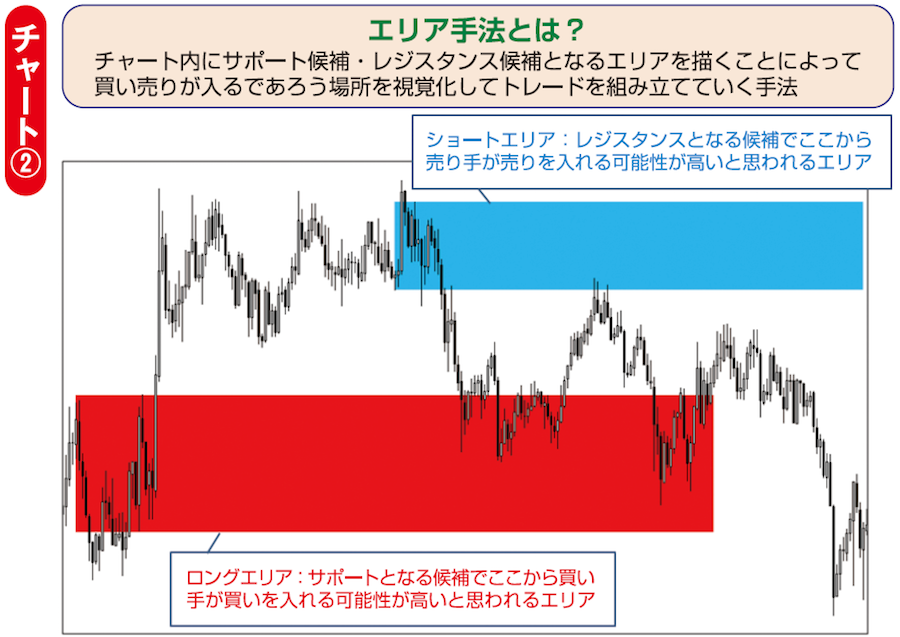
The Area Method is a technique that visualizes buy and sell areas by drawing potential support and resistance areas within the chart and builds trades accordingly.
How to Find a Competitive Edge in the Market
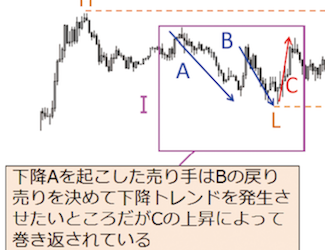
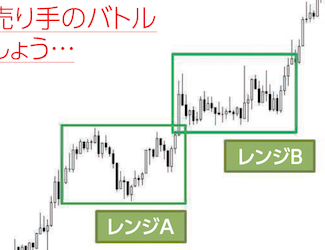
So, how can we find high-probability supports and resistances within the chart? The market has buyers and sellers, and their ongoing battles cause the chart to move up and down to form candlesticks.
For buyers, support is the point they must defend to connect to the next rise; for sellers, resistance is the point they don’t want to be broken above. In short, support is the point buyers don’t want to be broken below, and resistance is the point sellers don’t want to be broken above.
By identifying areas with high market edge, you also locate support and resistance. An area with a high edge is a place where the next move is likely to go in one direction or the other; thus, if there is a high edge for buyers, there will be a support candidate below, and if there is a high edge for sellers, there will be a resistance candidate above.
The keyword for finding high-edge areas is the battle’s decisive point. A battle is where buyers and sellers fiercely contend; the decisive point is where one side wins. How to analyze candlesticks and how to identify the decisive point will be explained in upcoming issues.
※This article is a re-edited version of FX攻略.com’s August 2017 issue