Ichimoku Kinko Hyo Introduction | Session 11: 9-Week Foot and 9-Month Foot [Supervised by Sada Tetsuo (Sanseiichimeiyama Jin)]
【Intro to Ichimoku Kinko Hyo [Supervised by Tetsuo Hosoda (Sanso Ichimoku Sanjin)]] Serial articles (14 in total)
・Chapter 1 The Origin of Ichimoku Kinko Hyo(Free)
・Chapter 2 The Three Movements and Time Relationships I
・Chapter 3 The Three Movements and Time Relationships II
・Chapter 4 What Can Be Deduced from the Three Movements, Time Relationships, and Price Relationships
・Chapter 5 Conversion Line and Base Line I
・Chapter 6 Conversion Line and Base Line II
・
・
・
・
・
・
・
・
Table of Contents for Chapter 11
1. The 9-Week Chart published in “Ichimoku Kinko Hyo Weekly Edition”
2. The 9-Week Chart is a simplified version of Ichimoku Kinko Hyo, but…
3. How to create the 9-Week Chart and how to judge Yin and Yang
4. Points of the USD/JPY 9-Week Chart and 9-Month Chart
5. Points of the EUR/USD 9-Week Chart and 9-Month Chart
6. Quick facts about Ichimoku Kinko Hyo
Profile of Tetsuo Hosoda

Hosoda Consulting, Ltd. Sanso Ichimoku Sanjin. Following the legacy of Ichimoku Sanjin, he is engaged in disseminating the correct use of Ichimoku Kinko Hyo. He writes market commentary and candlestick lectures for the “Ichimoku Club” hosted by Hosoda Consulting. Every Monday on Radio Nikkei Market Press, he broadcasts “Technical Analysis from the Nikkei Average Ichimoku Kinko Hyo.”
Official site:Ichimoku Kinko Hyo Official Website | Hosoda Consulting, Ltd
Copyright of Ichimoku Kinko Hyo is owned by Hosoda Consulting, Ltd, which also publishes the original works. For purchasing the original works, please visit the Ichimoku Kinko Hyo official website.
Services | Ichimoku Kinko Hyo Official Website | Hosoda Consulting, Ltd
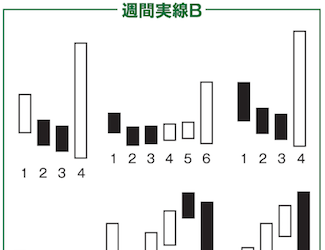
The 9-Week Chart announced in “Ichimoku Kinko Hyo Weekly Edition”
Last time, we covered the bell-shaped graph, the pattern of preparatory construction. This represents the time allocation for the downward three-movement phase, solidifying the base value of the fundamental figure “26,” and showing a breakout from consolidation… aligning perfectly with the Ichimoku Kinko Hyo concept (a classic example). This is described in Ichimoku Kinko Hyo: The Final Chapter.
We also explained the overview of the 9-week chart. In the Weekly Edition, the idea was announced: the weekly close and the 9 weeks-ago open create a bullish or bearish candle. By counting these successive bullish or bearish candles and comparing with the basic values, you learn the market’s present condition.
The main advantage of the 9-week chart is its simple construction. Today you can easily display Ichimoku on a computer forex program, but in the past, hand-drawn charts were the norm. Each week, plotting many charts was time-consuming and many people could not do it.
The Weekly Edition states that the 9-week chart was prepared to solve that difficulty. By checking the week’s close once a week, you can draw the chart, and the method itself embodies the concept of the basic values.
The 9-week chart compiles the period of the base value “9” and visualizes its movement. It is by nature easily aligned with basic values, and counting bullish and bearish candles helps grasp the time relationships, providing convenience. From its method of construction, you can anticipate future values; the starting values for the next 8 weeks can be forecasted to determine how much movement will create a bullish (bearish) candle.