
Ichimoku Kinko Hyo Introduction | Lesson 4: What Can Be Understood from Three Phases and Time Relationships, Price Relationships [Supervised by Tetsuo Hosoda (Sanse Ichimoku Yama Hito)]

[Ichimoku Kinko Hyo Intro (Supervised by Tetsuo Hosoda, Sanei Ichimoku Sanjin)] Serialized article series (14 parts)
・Part 1: The Origin of Ichimoku Kinko Hyo (Free)
・Part 2: Three Movements and Time Relationships I
・Part 3: Three Movements and Time Relationships II
・Part 4: What Can Be Understood from Time Relationships and Price Relationships
・Part 5: The Conversion Line and Base Line I
・Part 6: The Conversion Line and Base Line II
・
・Part 8: Leading Span and Lagging Span I
・Part 9: Leading Span and Lagging Span II
・Part 10: The “Pattern” of Preparatory Structure and 9-Week Chart
・Part 11: 9-Week Chart and 9-Month Chart
・Part 12: The B and Y of the Weekly Line Chart and the Near-Rate Line
・Part 13: How to Use B and Y
・Part 14: Contents of the Original Ichimoku Kinko Hyo
Table of Contents for Part 4
1. Interpretation of Calculated Values Achieved and Market Levels
2. Review of Time Relationships and Price Relationships
3. Identifying Key Points Based on Price Movements
4. What Can Be Deduced from the Equal Values of the USD/JPY Daily Chart and Calculated Values
5. Ichimoku Kinko Hyo Quick Facts
Interpretation of Calculated Values Achieved and Market Levels
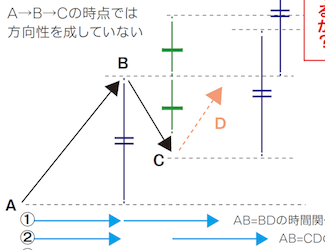
Last time we explained “three-move time relationships and price relationships.” In brief, when the first wave and second wave are formed, the time required for the third wave becomes known. Within that time, read how far the third wave will extend (to what price level the move will continue) to understand how the market will unfold after the three moves.
E-calculated value is the price level when, after another extension, the length of the first wave is repeated. N-calculated value is the value formed by extending the length of the first wave from a pullback. V-calculated value is the amount that doubles the initial move from the pullback.
Among these, achieving the E-calculated value indicates that the momentum of the extension is dominant. Therefore, there is a possibility that the third wave or the entire three-wave structure forms a new first wave.
N-calculated value indicates that the third wave has not produced enough power to exceed previous influence. It can be interpreted as a trading range centered around the mid-price of the second wave (market level).
V-calculated value means the move ends up fluctuating with a width that is twice the pullback, so it does not exceed the limits of the range centered on the starting point of the second wave.
The copyright of Ichimoku Kinko Hyo belongs to Economic Fluctuation Research Institute Co., Ltd., which publishes the original work. For purchasing the original work, please visit the official Ichimoku Kinko Hyo website.
Services | Ichimoku Kinko Hyo Official Website | Economic Fluctuation Research Institute Co., Ltd.