Ichimoku Cloud Introduction Part 7: Conversion Line and Base Line③ [Supervised by Tetsuo Hosoda (Sansei Ichimoku Yamanin)]
【Intro to the Ichimoku Kinko Hyo (supervised by Tetsuo Hosoda (Sansei Ichimisanjin)) Part of a serialized article (14 installments)】
・Part 1 The Origin of the Ichimoku Kinko Hyo(Free)
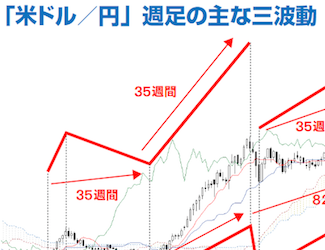
・Part 2 The Three Currents and Time Relationships I
・Part 3 The Three Currents and Time Relationships II
・Part 4 Things Learned from Time Relationships and Price Relationships
・Part 5 Conversion Line and Base Line I
・Part 6 Conversion Line and Base Line II
・Part 7 Conversion Line and Base Line III
・Part 8 Leading Span and Lagging Span I
・Part 9 Leading Span and Lagging Span II
・Part 10 The “Pattern” of Preparatory Structure and the 9-Week Chart
・Part 11 The 9-Week Chart and the 9-Month Chart
・Part 12 The Real Line on a Weekly Chart: B, Y and the Benchmark Line
・Part 13 How to Use B and Y
・Part 14 The Contents of the Original Text of the Ichimoku Kinko Hyo
Table of Contents for Part 7
1. When the equilibrium breaks, a rise or fall occurs
2. Will the market move or not? If it moves, will it rise or fall?
3. In markets that do not move or do move, the positional relationships of the Ichimoku
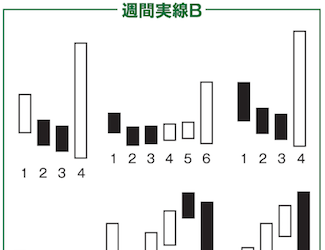
4. Expecting a range from basic numerical values
5. A “pattern” for understanding ranges
6. Quick facts about Ichimoku Kinko Hyo
Profile of Tetsuo Hosoda (Hosoda Tessei)

Hosoda Economic Fluctuation Research Institute Co., Ltd. Sansei Ichimoku Yamanito. Carrying on the legacy of Ichimoku Kinko Hyo, he works to popularize correct usage. He writes market explanations and charting lectures for the Ichimoku Kinko Hyo Club hosted by the Economic Fluctuation Research Institute, and hosts the weekly Monday program on Radio Nikkei Market Press titled “Technical Analysis Seen from Nikkei Average Ichimoku Kinko Hyo.”
Official site:Ichimoku Kinko Hyo Official Home Page | Economic Fluctuation Research Institute Co., Ltd.
Copyright of Ichimoku Kinko Hyo is owned by Economic Fluctuation Research Institute Co., Ltd., and the original edition is distributed for sale. For purchasing the original edition, please see the official Ichimoku Kinko Hyo homepage.
Services | Ichimoku Kinko Hyo Official Homepage | Economic Fluctuation Research Institute Co., Ltd.
When the equilibrium breaks, a rise or fall occurs
In the previous article, we explained that the movements of the equilibrium chart (Conversion Line and Base Line) can be predicted. It moves while being influenced by the high and low prices of the past 9 and 26 days, and as time passes, it shifts. If you understand this time relationship, you can read how the Ichimoku will move, when and how.
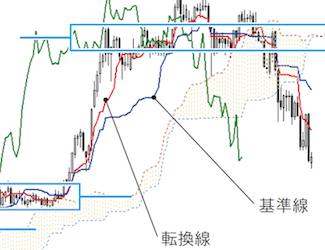
Also, on an actual chart, we examined how the equilibrium chart relates to the actual price line, noting two properties: ① it acts as a support or a rebound, and ② it functions as a market level (center of the range) — these two aspects were shown.
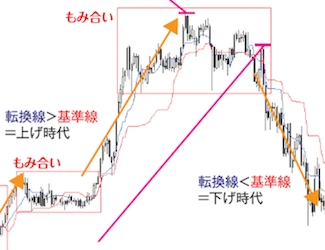
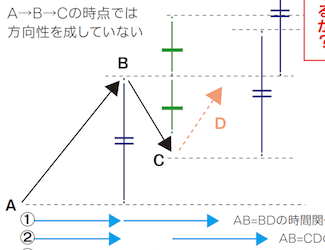
Now, Ichimoku Yamanito states“The market may not move, or it may move. If it moves, will it rise or fall?”The “not moving” market refers to range-bound markets, but what is important here is that even in rising or falling markets, depending on fluctuations, a range can form. Both the push and the pull should be viewed as ranges. The same thinking applies when a rising market reaches its peak or a falling market reaches its bottom.
In this range-bound (non-moving) phase, what matters is the market level. When the market begins to move, it is very common for it to depart from this level, becoming the starting point.“Since the market is completely in balance in the consolidation, when the balance breaks, it rises or falls.”This is how it is understood (※2).
※1 ※2 Ichimoku Yamanito, ‘Ichimoku Kinko Hyo’ (Economic Fluctuation Research Institute, 1975, p. 3 (※1), p. 136 (※2))