
Ichimoku Kinko Hyo Basics| Episode 6: Conversion Line and Base Line II [Supervised by Tetsuo Hosoda (Sansei Ichimoku Sanjin)]
【Ichimoku Kinko Hyo Intro [Supervised by Tetsuo Hosoda (Sansei Ichimoku Yamanito)]] serialized article (14 total)
・Episode 1 The Origin of Ichimoku Kinko Hyo(Free)
・Episode 2 The Three Movements and Time Relationships I
・Episode 3 The Three Movements and Time Relationships II
・Episode 4 What can be understood from the Three Movements, Time Relationships, and Price Relationships
・Episode 5 Conversion Line and Base Line I
・Episode 6 Conversion Line and Base Line II
・Episode 7 Conversion Line and Base Line III
・Episode 8 Leading Span and Lagging Span I
・Episode 9 Leading Span and Lagging Span II
・Episode 10 The “Pattern” of Preparation Structure and 9-Week Chart
・Episode 11 9-Week Chart and 9-Month Chart
・Episode 12 The Real-Line of the Week B, Y and the Bank Line
・Episode 13 How to Utilize B and Y
・Episode 14 The Contents of the Original Ichimoku Kinko Hyo
Table of Contents Episode 6
1. Why does the Ichimoku chart move? Understanding improves when you draw the graph
2. When and how does it become predictable
3. Market rule of thumb “Pullbacks are half”
4. Ichimoku indicates the retracement and market level at half-value
5. Uptrend or pullback or range can be understood at a glance
6. Ichimoku Kinko Hyo: Little-known facts
Tetsuo Hosoda Profile

Hosoda Tessei Co., Ltd. Ichimoku Yamanito. Carrying on the legacy of Ichimoku Yamanito, he is engaged in disseminating the correct use of Ichimoku Kinko Hyo. He writes market commentary and charting courses for the “Ichimoku Kinko Hyo Club” hosted by Economic Variability Institute. Every Monday he broadcasts “Technical Analysis from Nikkei 225 Ichimoku Kinko Hyo” on Radio NIKKEI Market Press.
Official site:Ichimoku Kinko Hyo Official Homepage | Economic Variability Institute
The copyright of Ichimoku Kinko Hyo is held by Economic Variability Institute, which publishes the original work. For purchasing the original, please visit the official Ichimoku Kinko Hyo homepage.
Services | Ichimoku Kinko Hyo Official Homepage | Economic Variability Institute
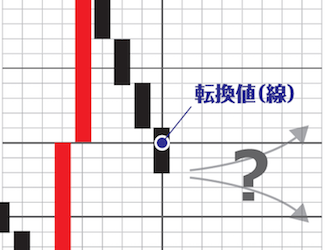
Why does the Ichimoku chart move? Understanding improves when you draw the graph
Last time, we explained the overview of the Ichimoku chart (Conversion Line and Baseline) and how to construct it. To recap, the Ichimoku chart is a set of lines formed by connecting values derived from calculating half of the high and low within the given period (9 days, 26 days).
And to have you actually feel constructing it by hand, we prepared a simple exercise. Were you able to try it?
By working through this exercise, your understanding of the movement of the Ichimoku chart should have deepened. In particular, you should grasp questions like “why does the Ichimoku chart move up and down” and “how long it will continue to move in this way.”
This sense can only be obtained by handwriting the chart. No matter how long you look at Ichimoku charts in a computer charting tool, you cannot match the experience of hand drawing.
Below, we present the answers to the exercise and explain, with examples, the points at which the movement of the Ichimoku chart can be predicted.