

We have released a method explanation video for Indicator Recovery. The title is "Does the signal work in EUR/JPY?"
0
This is a method explanation video aimed at purchasers of the Indicator Recovery and those considering purchasing in the future.
What you get when you automate the signal tool for full automatic trading is Super Recovery.
We heard from Gogojungle that selling SuperRecovery would take about one month after forward testing at Gogojungle.
I am surprised at how long it is taking, more than I expected.
We have received many inquiries about purchasing SuperRecovery, but at this time the sale has not started for that reason.
Please wait for a little longer.
Trading a sign tool with discretionary judgment is discretionary trading using Indicator Recovery.
Signals should not be followed blindly; at the moment of signal confirmation or immediately after, you must assess the market flow on higher and lower time frames to make a judgment.
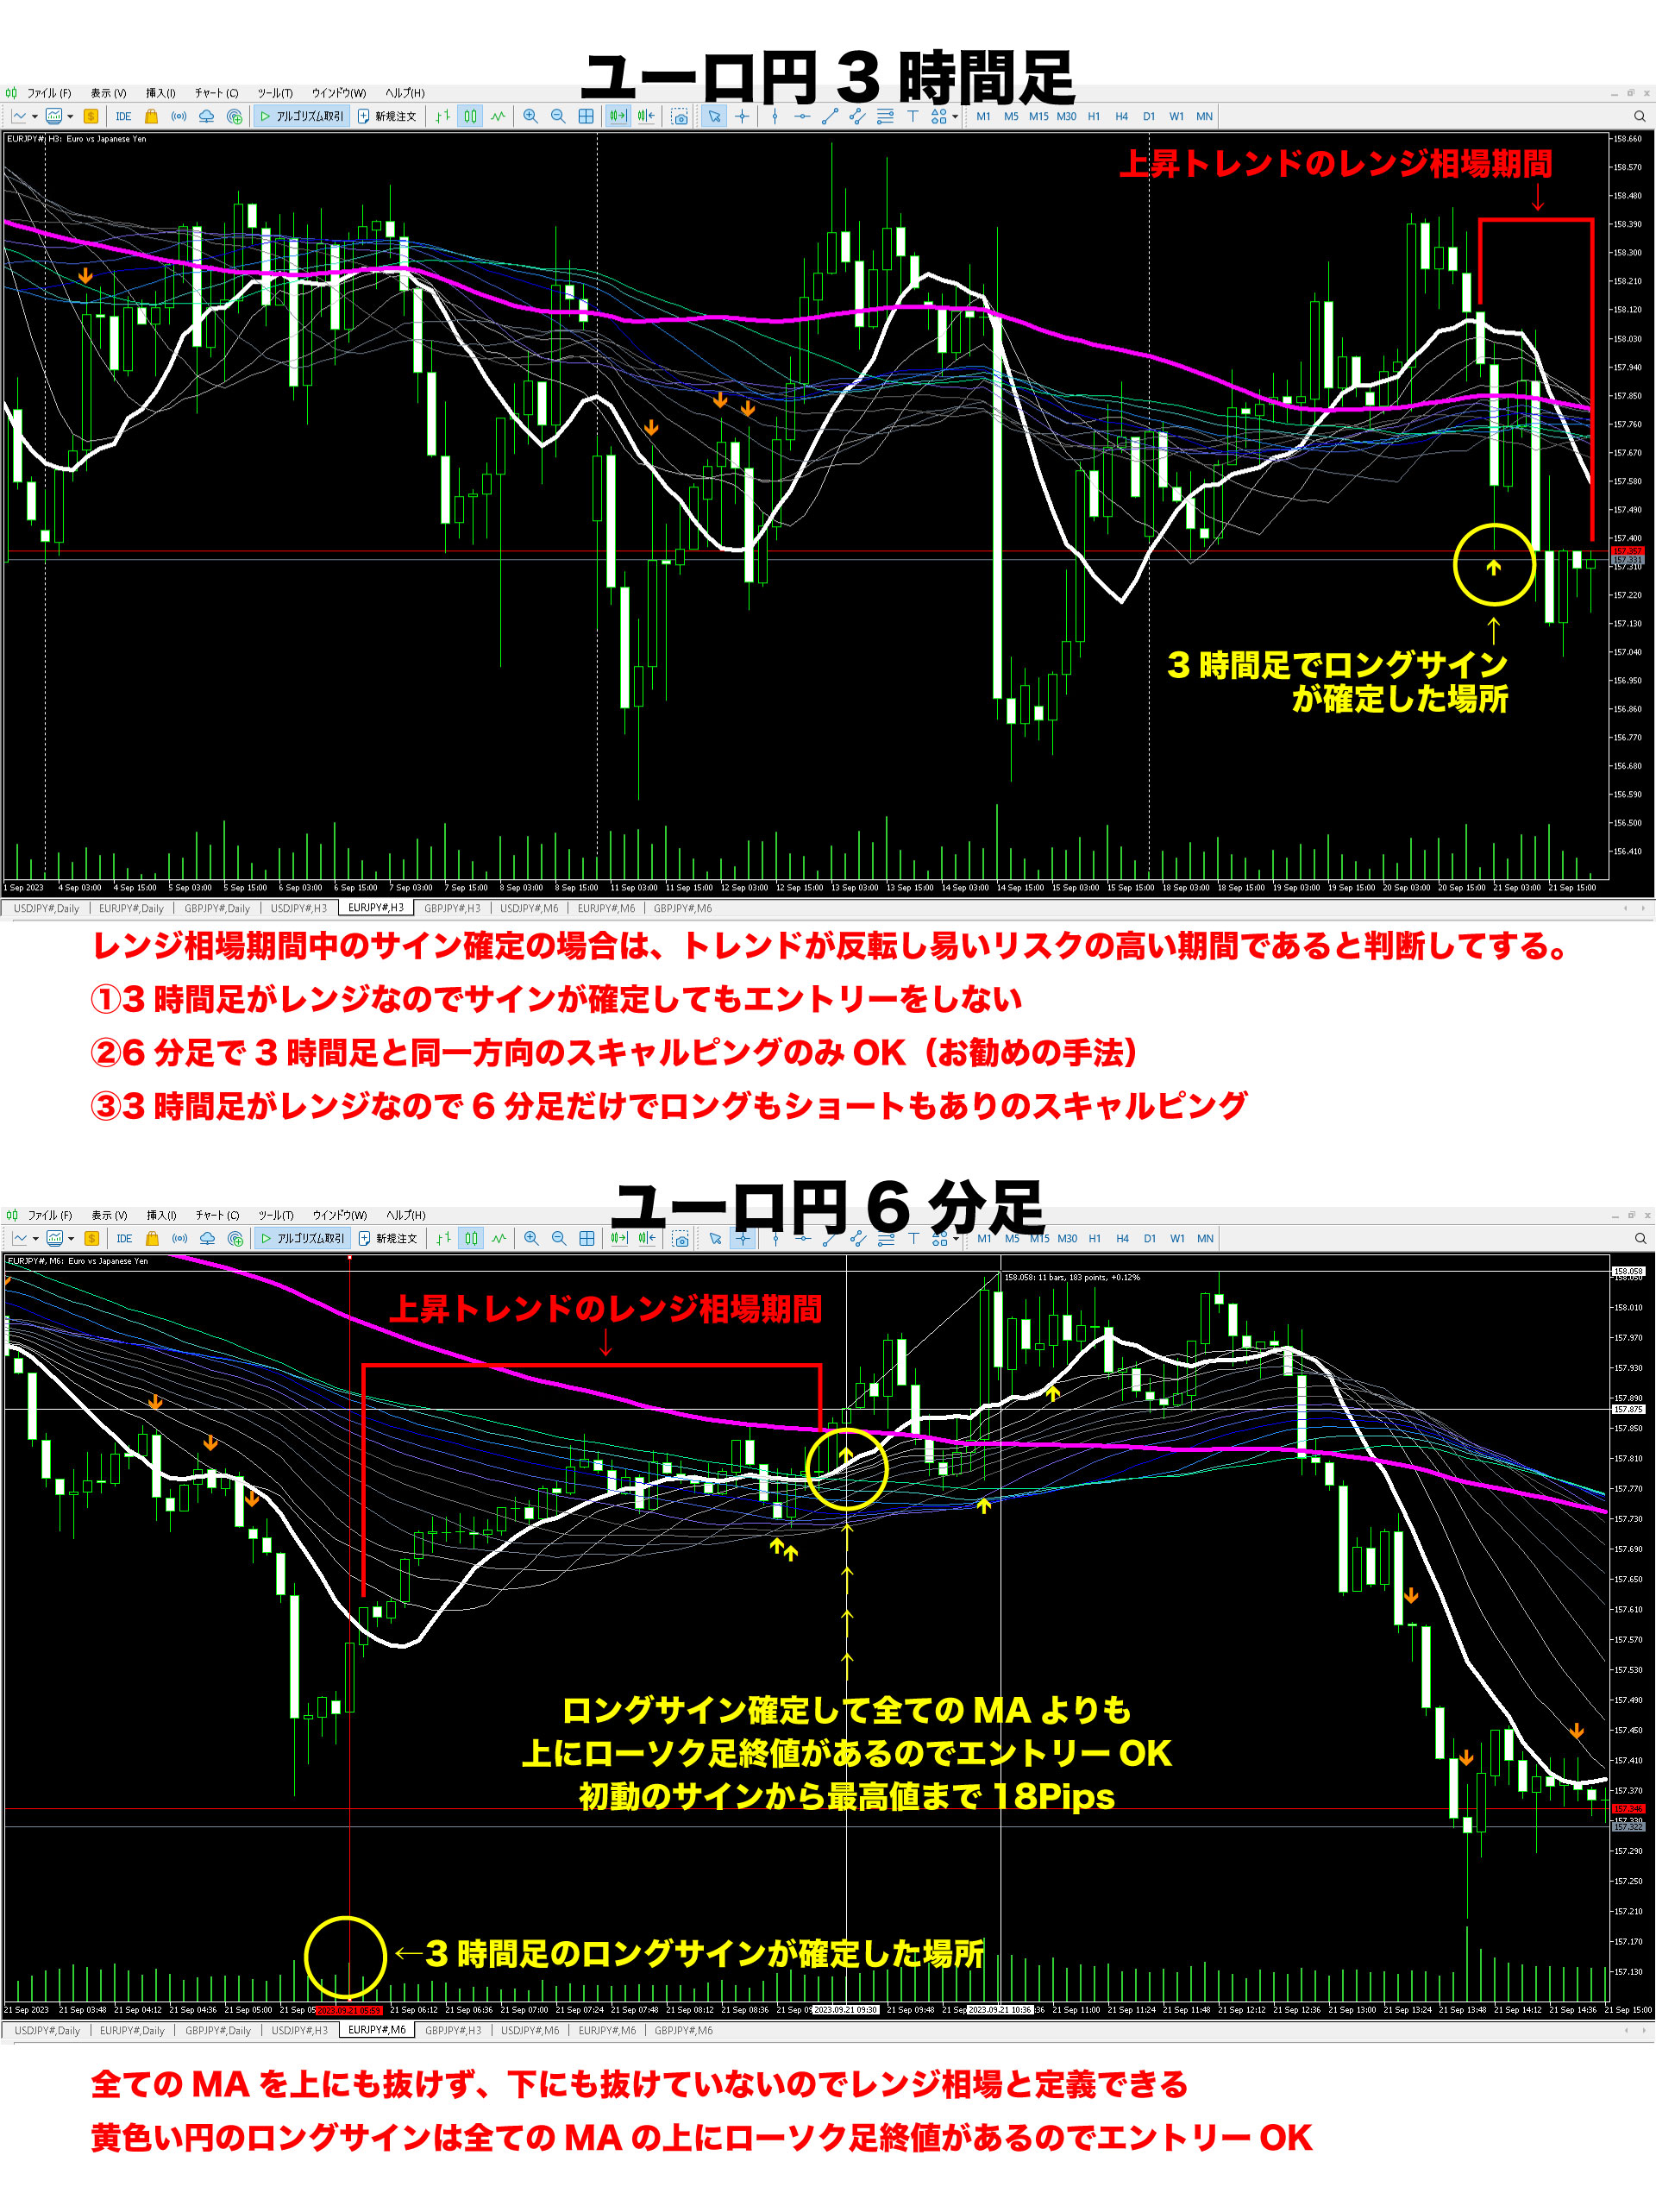
Last weekend, a long signal on the 3-hour chart for EUR/JPY was confirmed.
That means this week you can only take long entries on the lower 6-minute chart according to the rule.
Where and on what basis do you enter?
We explained such concrete methods in a video commentary while showing the signal tool.
For details on the indicator, see here.
For example, in this EUR/JPY case, let's look at the definition of the trend on the 3-hour chart as a recent example.
First, I think there are four main definitions of a trend.
① Uptrend
② Range after an uptrend
③ Downtrend
④ Range after a downtrend
The signal tool’s signal confirmation is defined by applying certain conditions to the trend.
However, the accuracy judgment at the time of signal confirmation is a key element of discretionary trading.
Please look at the figure below.
In the upper figure, the crucial point is the issue of signal confirmation versus discretionary judgment.
Signals are meaningless if you doubt them endlessly, but if you trust them 100%, there is no point in discretionary trading.
Trading exactly as the signal dictates is the job of an EA; if you trade discretionary, having clear discretionary criteria is important.
Then trade with those criteria in mind, aiming for win rate and risk-reward.
In the upper panel of the figure, the EUR/JPY on the 3-hour chart, a long signal was confirmed this week, but it occurred within a range market.
The range market period is indicated by a red line; it can be described as a range within an uptrend, or a range from the previous short-term downtrend—it's a subtle market condition.
In short, there is no change to a range, but the entry is difficult due to the market condition.
There are many definitions of a ranging market, but here we define it by price action relative to all moving averages from period 10 to period 104.
What to pay particular attention to is the closing price of the candlestick.
And how the next candle will act relative to the previous candle's close?
For this EUR/JPY 3-hour signal confirmation candlestick, does it want to move toward the high?
Does it want to move toward the low?
It is not clear, and for all moving averages, there is no clear breakout up or down, yet a long signal was confirmed.
In other words, since it is a long signal, we define it as an uptrend, but it is a range market within an uptrend.
If you determine it is a range market, there are three actions as shown in the diagram.
① is the safest and most beginner-friendly.
② is for intermediate traders accustomed to scalping, allowing shallow stop-loss and shallow take-profit with a risk-reward ratio of at least about 1:1.
③ is not recommended, but for advanced traders. It would be an area for those who have practiced method ② extensively to attempt.
Note: In the 10 years I have suffered over 30 million yen in losses only from trading method ③, and I traded on a 1-minute chart only, incurring big losses with small gains.
The lower the price, the higher the risk, so if you struggle with shallow stop losses or take profits, you might be better off not trading in range markets.
See you again.
× ![]()