
【Indicator Recovery Manual Vol.3】MT5 backtest accuracy verification and real account trading history (discretionary trades use Indicator Recovery)
0
To purchasers and those considering purchasing
We recorded a YouTube video with the title above.
The first half is a review of Super Recovery, an EA that fully automates Indicator Recovery signals for trading.
The verification consists of a comparison between MT5 backtests and actual trading histories on a real account in operation.
1. Features of MT5 backtesting include testing with spreads that actually fluctuated.
2. The test reflects delays that occur during data transmission between the broker’s server and the client.
3. The test reflects price movements based on realistic data.
From these, MT5 backtests depict market fluctuations more realistically than MT4.
With these as the theme, the first half tested backtesting and forward testing on a real account.
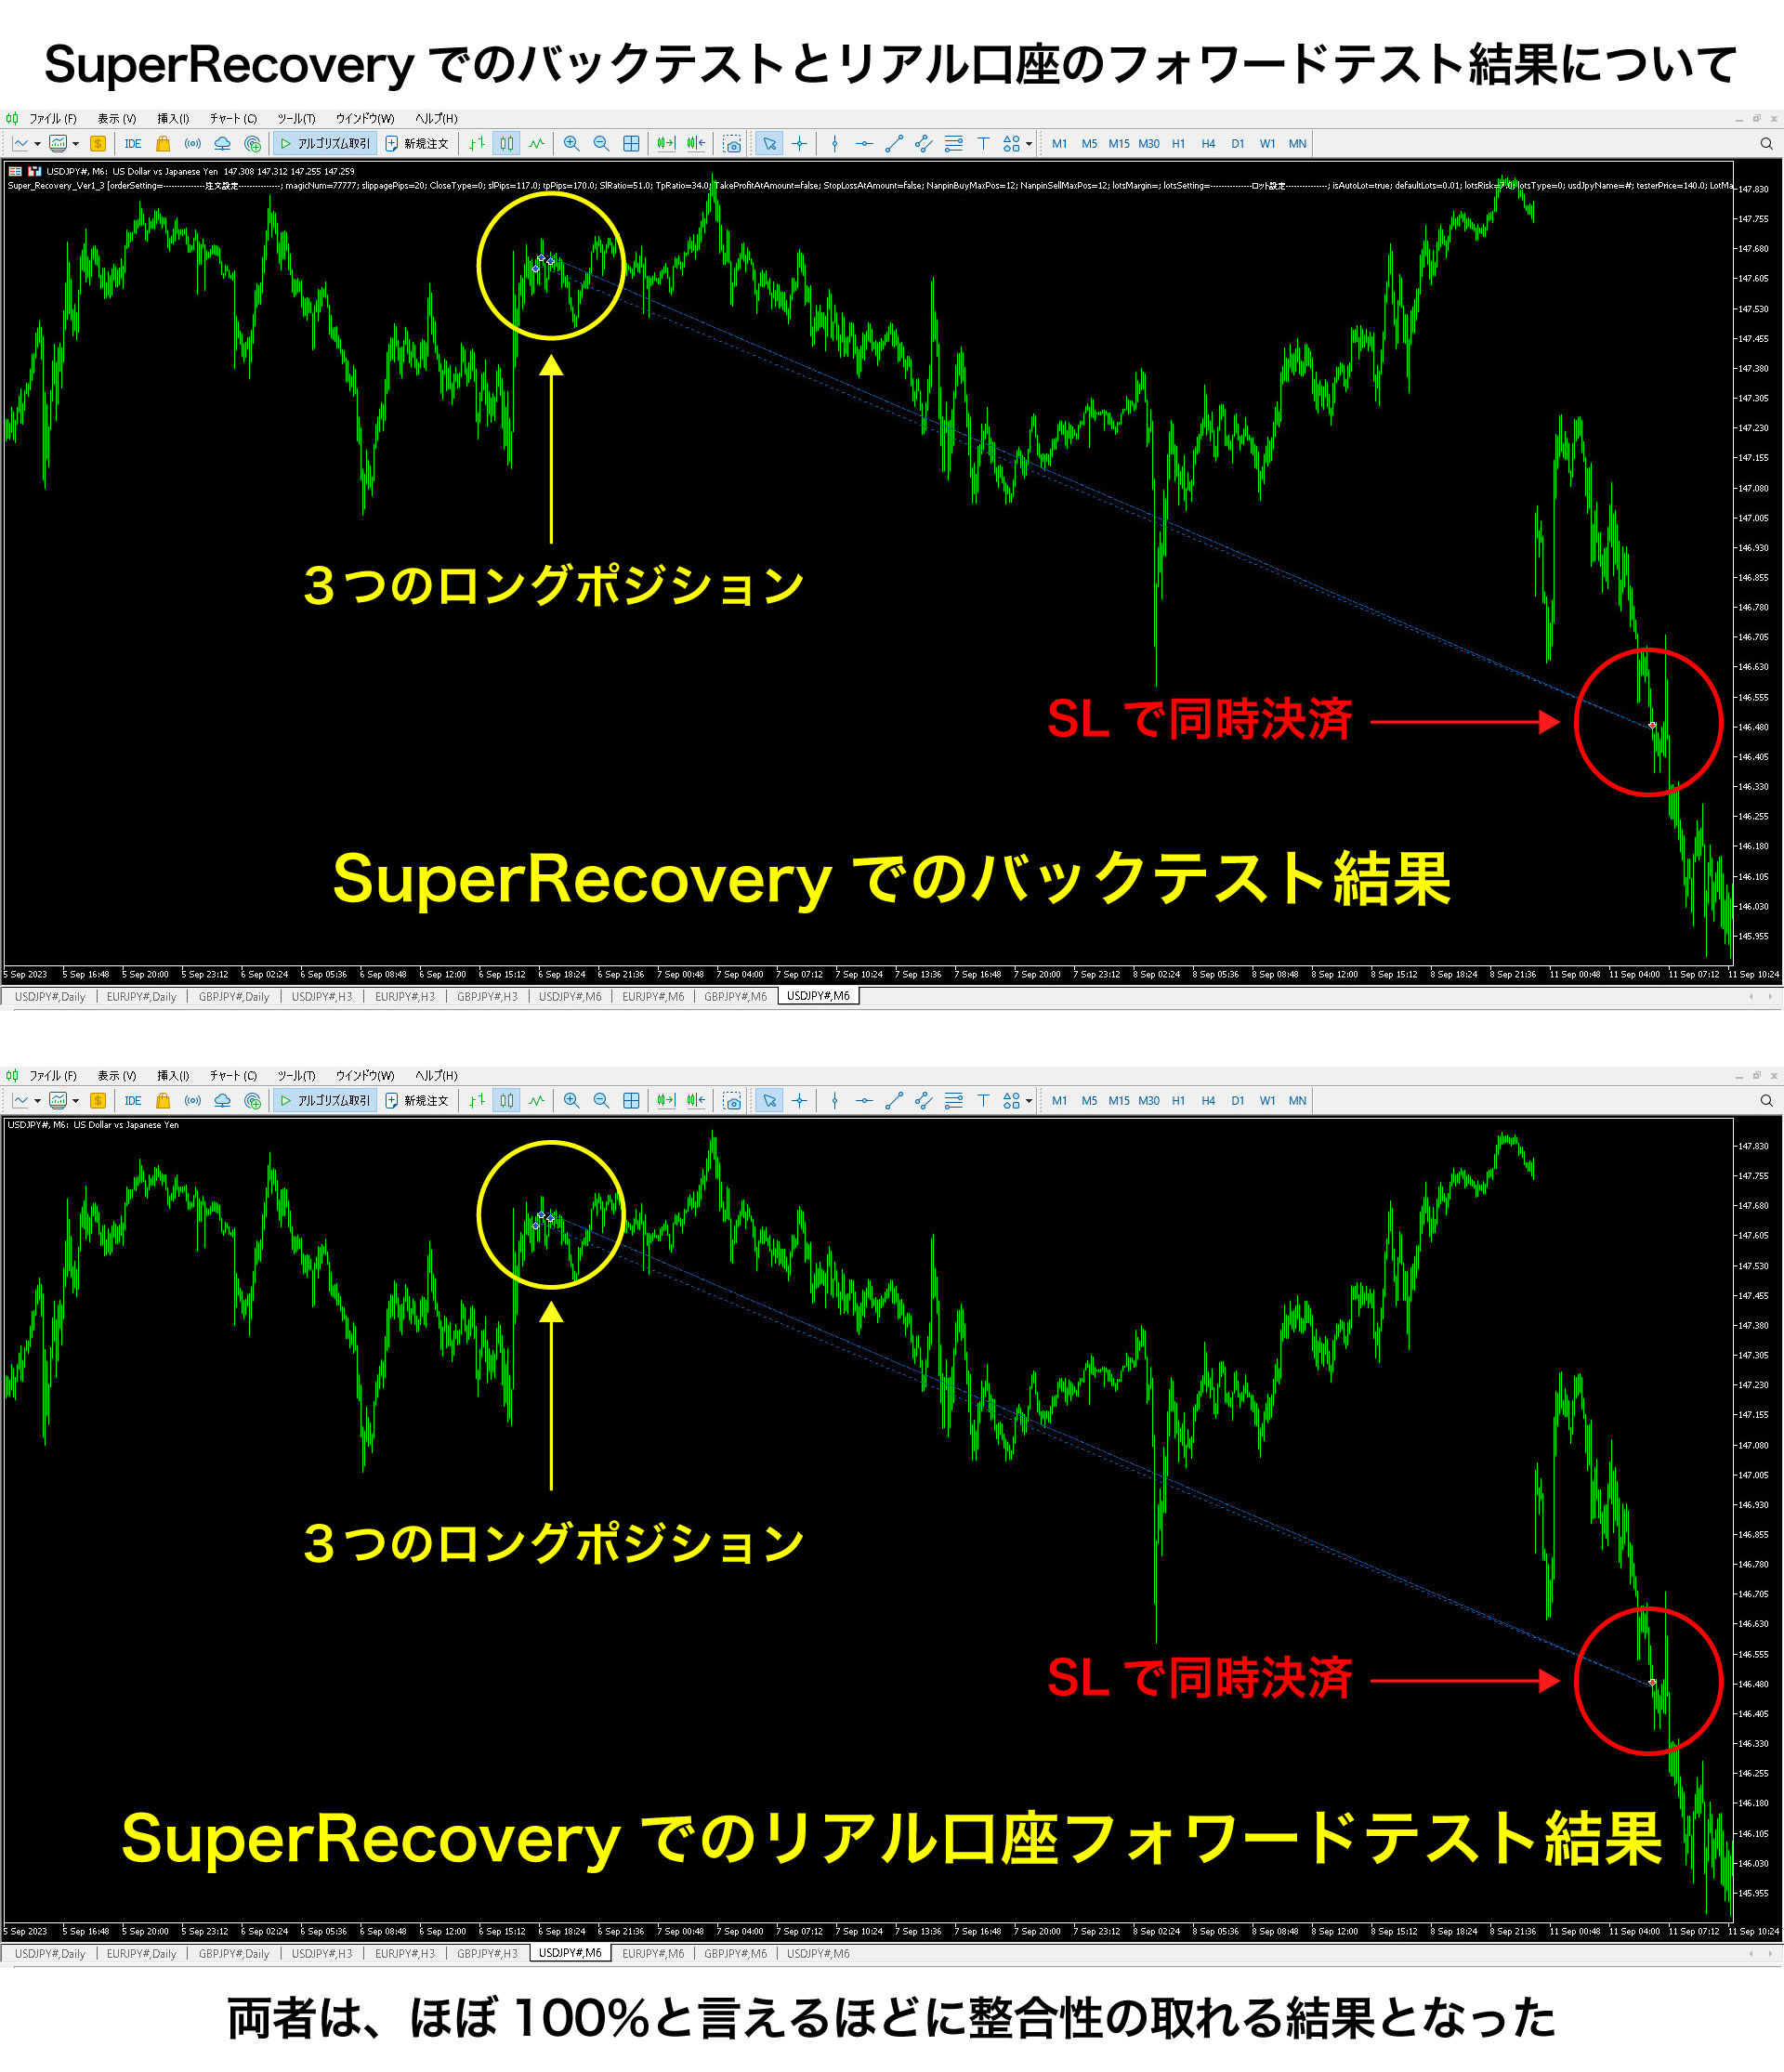
The image on the left above shows MT5 backtest trading history, and the image on the right shows trading history from an actual real account.
Both are the trading histories of automated trading with Super Recovery.
Comparing them, the forward test results on the real account are almost identical to the backtest results, nearly 100% match.
The MT5 backtest trading history is almost indistinguishable from the real account trading history.
I plan to continue recording this as we trade on real accounts in the future.
SuperRecovery has been launched, but purchasing seems to be a little further ahead.
Forward testing on Gogojungle has begun, and if there are no issues, sales will commence.
https://www.gogojungle.co.jp/systemtrade/fx/46181
The documents submitted to Gogojungle for this are the backtest results below.
Unfortunately, test results from other providers such as Forex Finest, OANDA Securities, and AVA Trade did not yield highly accurate results even when importing TDS, so I tested with XM using 25x leverage and with the initial margin of 1 million yen, similar to domestic securities firms.
The results are shown here.
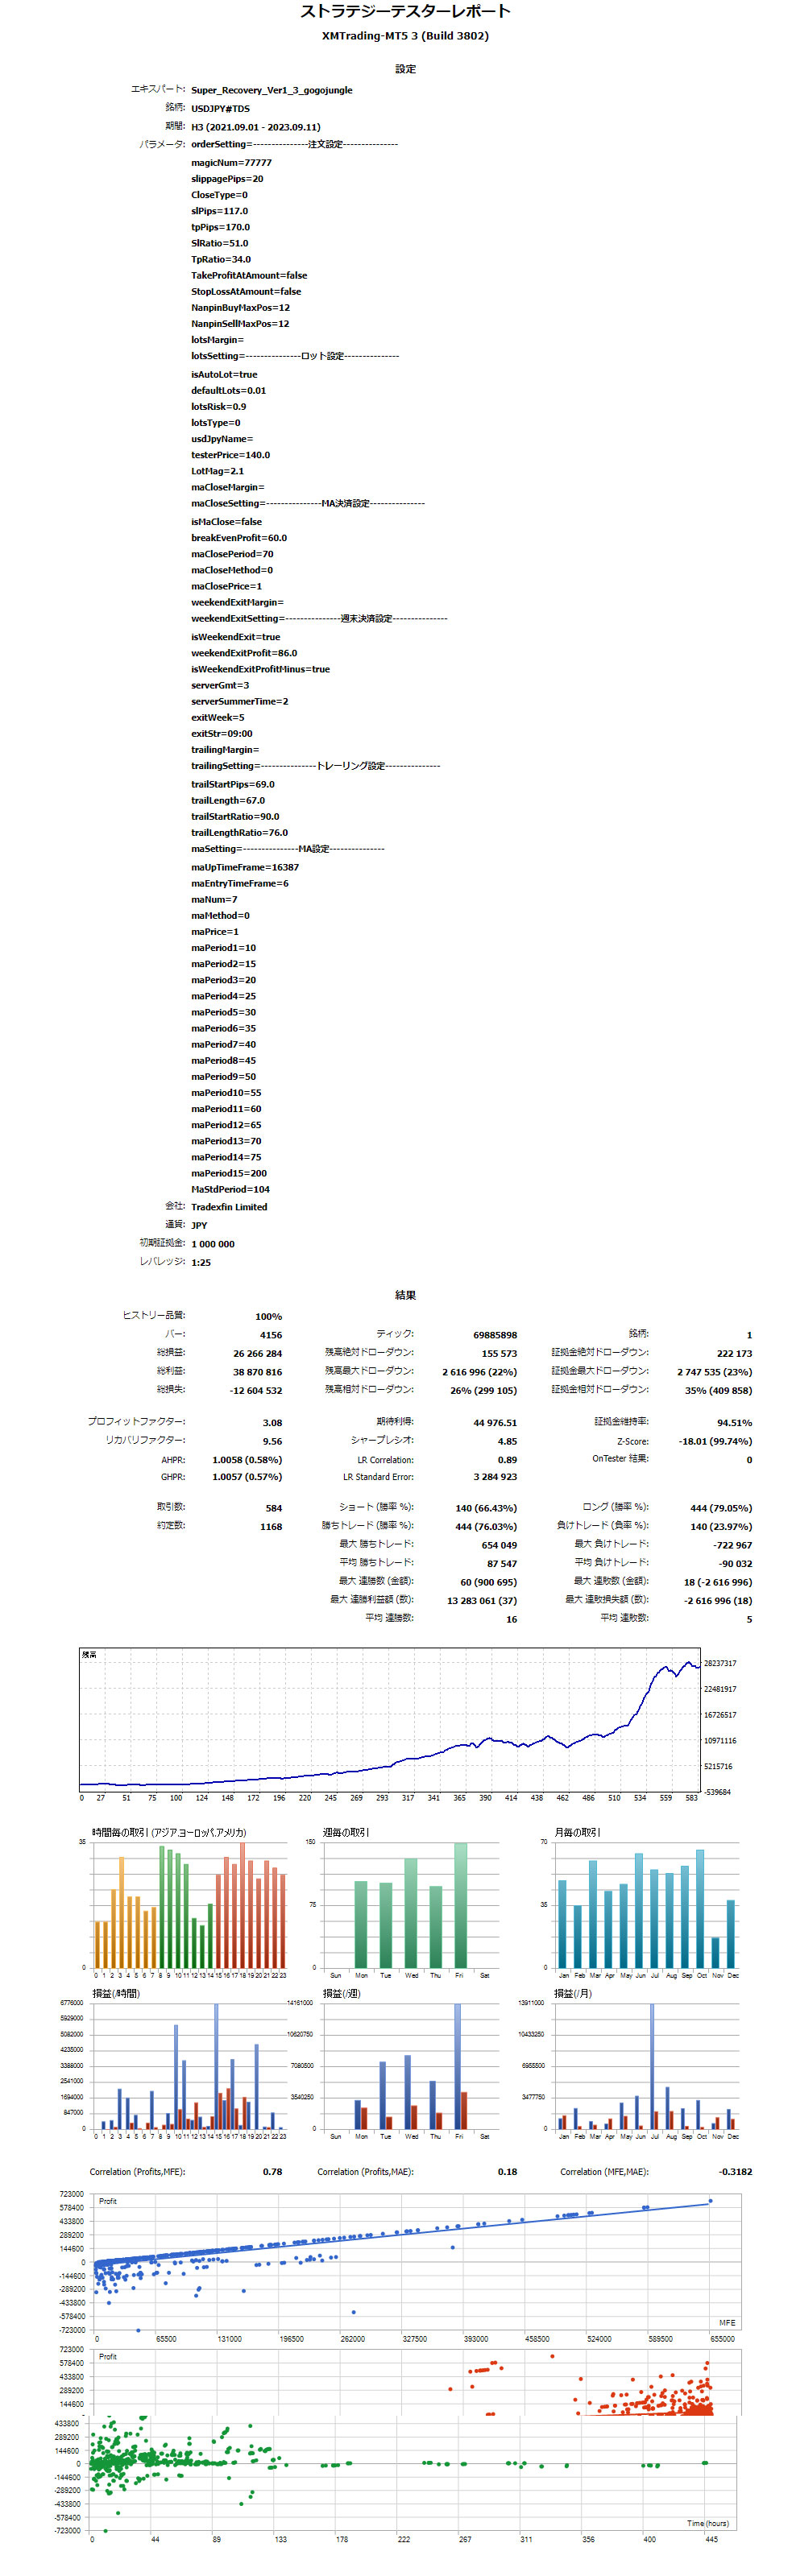
The above image is a test where TDS was imported to XM, resulting in 100% quality and high precision.
In the most recent two years, 1 million yen grew to 26 million yen.
In high-leverage tests, this grew from 100,000 yen to 1.1 billion yen, but offshore accounts carry higher risk, including delays or refusals of withdrawals due to recent broker failures.
Therefore, domestic brokers that Gogojungle also recommends are preferable.
Indicator Recovery details page
https://www.gogojungle.co.jp/tools/indicators/45724
The latter half is a tutorial video explaining how to use Indicator Recovery. It explains, for purchasers, how to use Indicator Recovery for FX trading, including definitions of trend, entry and exit techniques. The methods are explained as clearly as possible, aimed at beginners and intermediate traders.
A message from me.
Beginners should reduce the number of entries and trade only in situations where it really matters.
Keep the 3-hour sign direction in mind, observe price action, and consider where and how the sign appeared.
How accurate are the signs?
If signs are correct, when can you enter on the lower 6-minute chart in the same direction as the higher time frame?
I want you to quickly develop the ability to judge sign accuracy.
And when you’re unsure or unclear, it is important not to enter the market.
What does a pull-back look like?
What defines a retracement high?
Please focus on observing and questioning these things.
I would be glad if you reread this Investment Navi+ article and the YouTube video explanations to master the methods.
For intermediate traders, focus on signs on daily and 3-hour charts, but also consider range direction sense and price action relative to MA periods 10 and 104, adapting with small profits and small stop losses through scalping to achieve a high win rate.
The direction of signs means the MA Perfect Order = PO.
This Indicator Recovery sets PO with 7 MAs, so in range markets, it tends to give buy signals at the top and sell signals at the bottom.
Even in such cases, quickly discern the signals, and understand what PO means: has the market reversed into a new trend?
Or is it merely a pullback?
Is it a retracement?
Is it a direction-less range market?
Sometimes, a strong initial signal occurs when a large trend starts.
While grasping the daily trend, define the near-term trend on the 3-hour chart, and if that direction and the 3-hour price action align, enter and exit on the lower 6-minute chart, and in range markets, aim for small profits through scalping.
If the daily and 3-hour timeframes are aligned in a major opposite market, manually trailing on the 6-minute chart or using automatic trailing stops when away from the seat to limit drawdown is advisable.
Both beginner-focused and intermediate-focused approaches are integrated into the SuperRecovery logic that automates the Indicator Recovery.
For those who feel discretionary trading is too time-consuming or mentally demanding, a fully automated product is also available, so hybrid or single-method approaches are both viable.
See you again.
× ![]()