

Video manual delivery for Indicator Recovery has started! PDF manual distribution has started at the same time!
There was a request from buyers of Indicator Recovery for more detailed methods and manuals beyond the information written in the overview on the sales page, so in response to that, we immediately recorded a video, edited it, and uploaded it to YouTube as the Indicator Recovery manual video.
And as soon as the video was uploaded, I also uploaded a PDF file.
Although the content is the same, after recording the video I created a printable PDF manual with still images and text, so I would like to share it with purchasers and those considering purchasing.
Please refer to the following images for the still image manual and the methods.
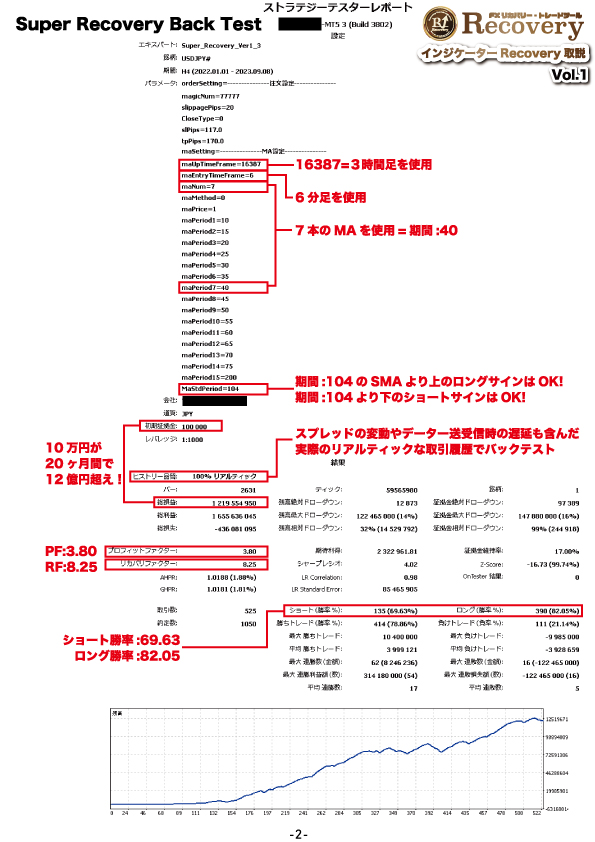
The figure above appears many times, but it is crucial evidence for Indicator Recovery, so why this MA?
Why are the periods: 40, or 104, etc. important?
Also, the explanation for the seven MAs’ golden cross and dead cross is supported by compelling evidence calculated by turning Indicator Recovery into a fully automated trading EA, so it is considered important.
When the EA is sold, I will explain the parameters of Super Recovery again, but there are so many items that even a high-spec PC would normally take a week just for optimization tests.
The test shown above took a week to derive the answer.
Even for a single currency pair, there are about 20,000 possible optimization combinations, so after five tests it becomes hundreds of thousands.
Super Recovery is still evolving daily with ongoing fixes.
Even adding a single parameter creates a time dilemma where you must run tens of thousands of tests from the start to get an answer.
As I mentioned in yesterday’s purchaser email, even from January 1, 2022 to today, September 8, 2023, it takes more than 3 days.
Around 2020, it took one week.
Gogojungle requires seven years of backtesting for EA sales.
No domestic broker has MT5 historical data, so I investigated and found that after they began handling MT5, they have historical data from that broker, but older data is said to be of poor quality because it comes from MetaQuotes.
So I decided to acquire paid data from TDS.
There seems to be a two-week free trial.
F Brooks? The Foreign Exchange Finest has been handling MT5 since 2020, so they said there is no data prior to that.
Even if you inquire with AVA TRDE, they said there is no historical data for the past seven years.
In the most recent backtests, for some reason the quality was poor and the data was as low as 18% at minimum.
The best was OANDA.
When I asked OANDA support, they said they would provide historical data older than 2016 as a service to clients with account balances of 700 million yen.
Today is September 8, 2023, so data from September 7, 2016 onward is obtainable, so I am reading the historical data and continuing tests.
If I obtain backtest results for seven years, I can submit them to Gogojungle for review.
Notice how this has diverged from the title, hasn't it?
Back to the main topic, I’m attaching page 2 of the PDF manual.
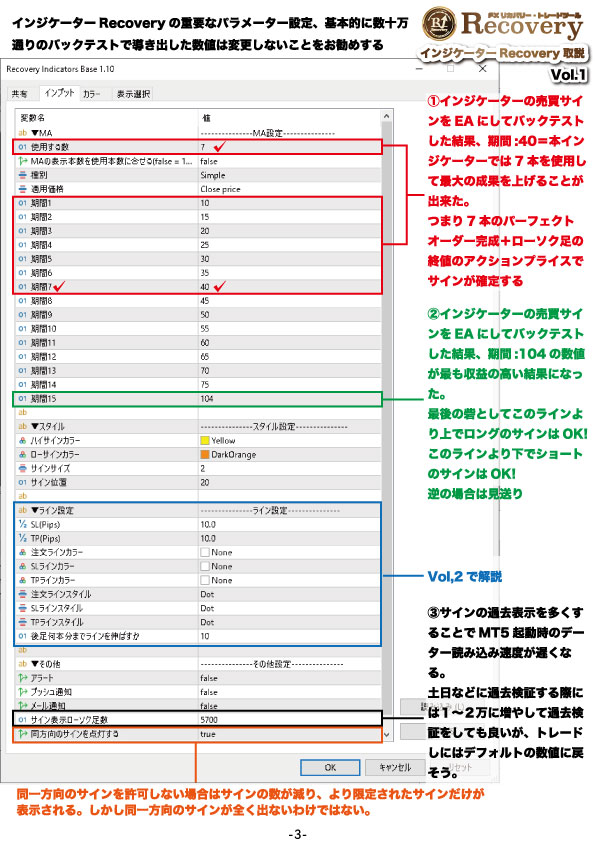
The figure above shows Indicator Recovery parameters.
The top-right ① is the MA setting item, but I think it’s fine to leave it at its default.
The number of MAs used is selected as 7 out of 15.
In the backtest results when Indicator Recovery was turned into an EA, seven MAs performed well, so I set this number.
This seven-MA count means that as you set 10/15/20/25, and so on, in five increments for a total of 15 MAs, how many perfect orders (PO) must be completed to generate a signal?
Answer: 7
That is what it means.
In the backtests derived from the EA, there were configurations with eight or three MAs, but the highest win rate for USD/JPY on the 4-hour chart used seven MAs by default.
② The default MA period is 104, and this value was the most profitable when turned into an EA.
This line is the longest moving average among 15 MAs, and using this value as a border, when the price is above the line and tends to rise, a long PO that completes makes it even more likely to rise further. This is the trading rule we use.
In tests with the EA, a filter was applied at period 104, and even if a long signal appeared below 104, it was skipped.
Conversely, if a short signal appeared above 104, it was also skipped, and the result showed good performance.
In the optimization tests used to calculate values, the final border value was tested from 10 to 400 in steps of 10, and the most profitable value was 100, so the next test narrowed to 90–110 in steps of 1 and chose 104.
The middle line setting is omitted this time.
This was made with the assumption of an EA, but it may not be necessary for discretionary trading.
③, however, when performing historical validation, up to how many candles back should signals be displayed?
Answer: 5700 candles.
That is what it means.
So if you input 10000, you can view even older signals.
However, increasing this number places a heavier load on loading past signals and slows chart rendering.
To make things as lightweight as possible, 5700 candles is the default.
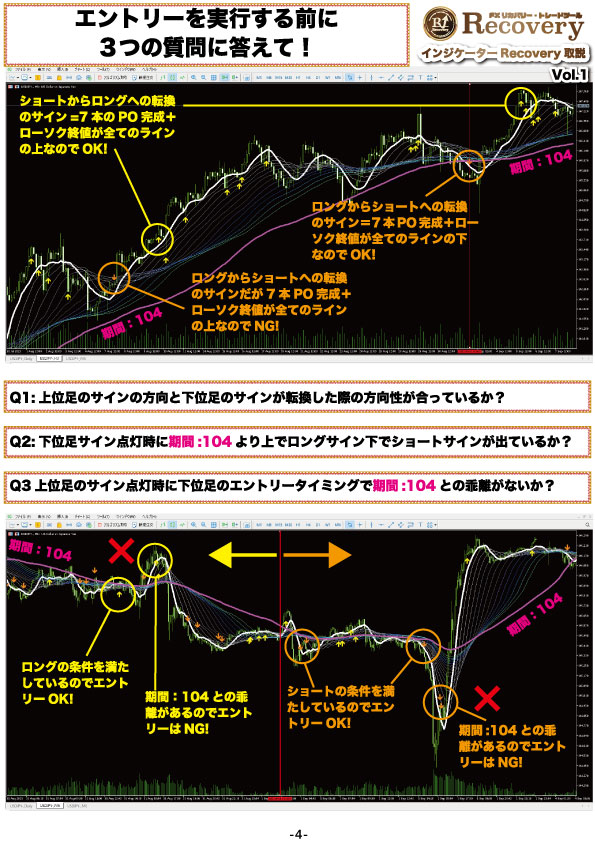
The figure above shows a simplified version of the trading rules.
Always strive to question yourself about the above three questions.
With such a habit, you develop the practice of looking at the long-term chart defined by the 3-hourly trend.
Moreover, by considering that trend, you can enter on the lower time frame (6 minutes) in the same direction as the higher-timeframe signals, while respecting the trend.
This habit extension allows you to grasp the signals and trends of the higher time frame while doing counter-trend scalping on the lower 6-minute chart, but for a while there may be many times when you cannot enter; in that case, it may be best to only enter when the signals align with the higher time frame.
Now, I will end here.
Next time, I will use actual entries and exits from my trades using this indicator to explain the trading method.