
What is the correlation between pyramid-building techniques that generate explosive profits in a short period and tech volume?
Good morning everyone.
Today is Monday, September 4.
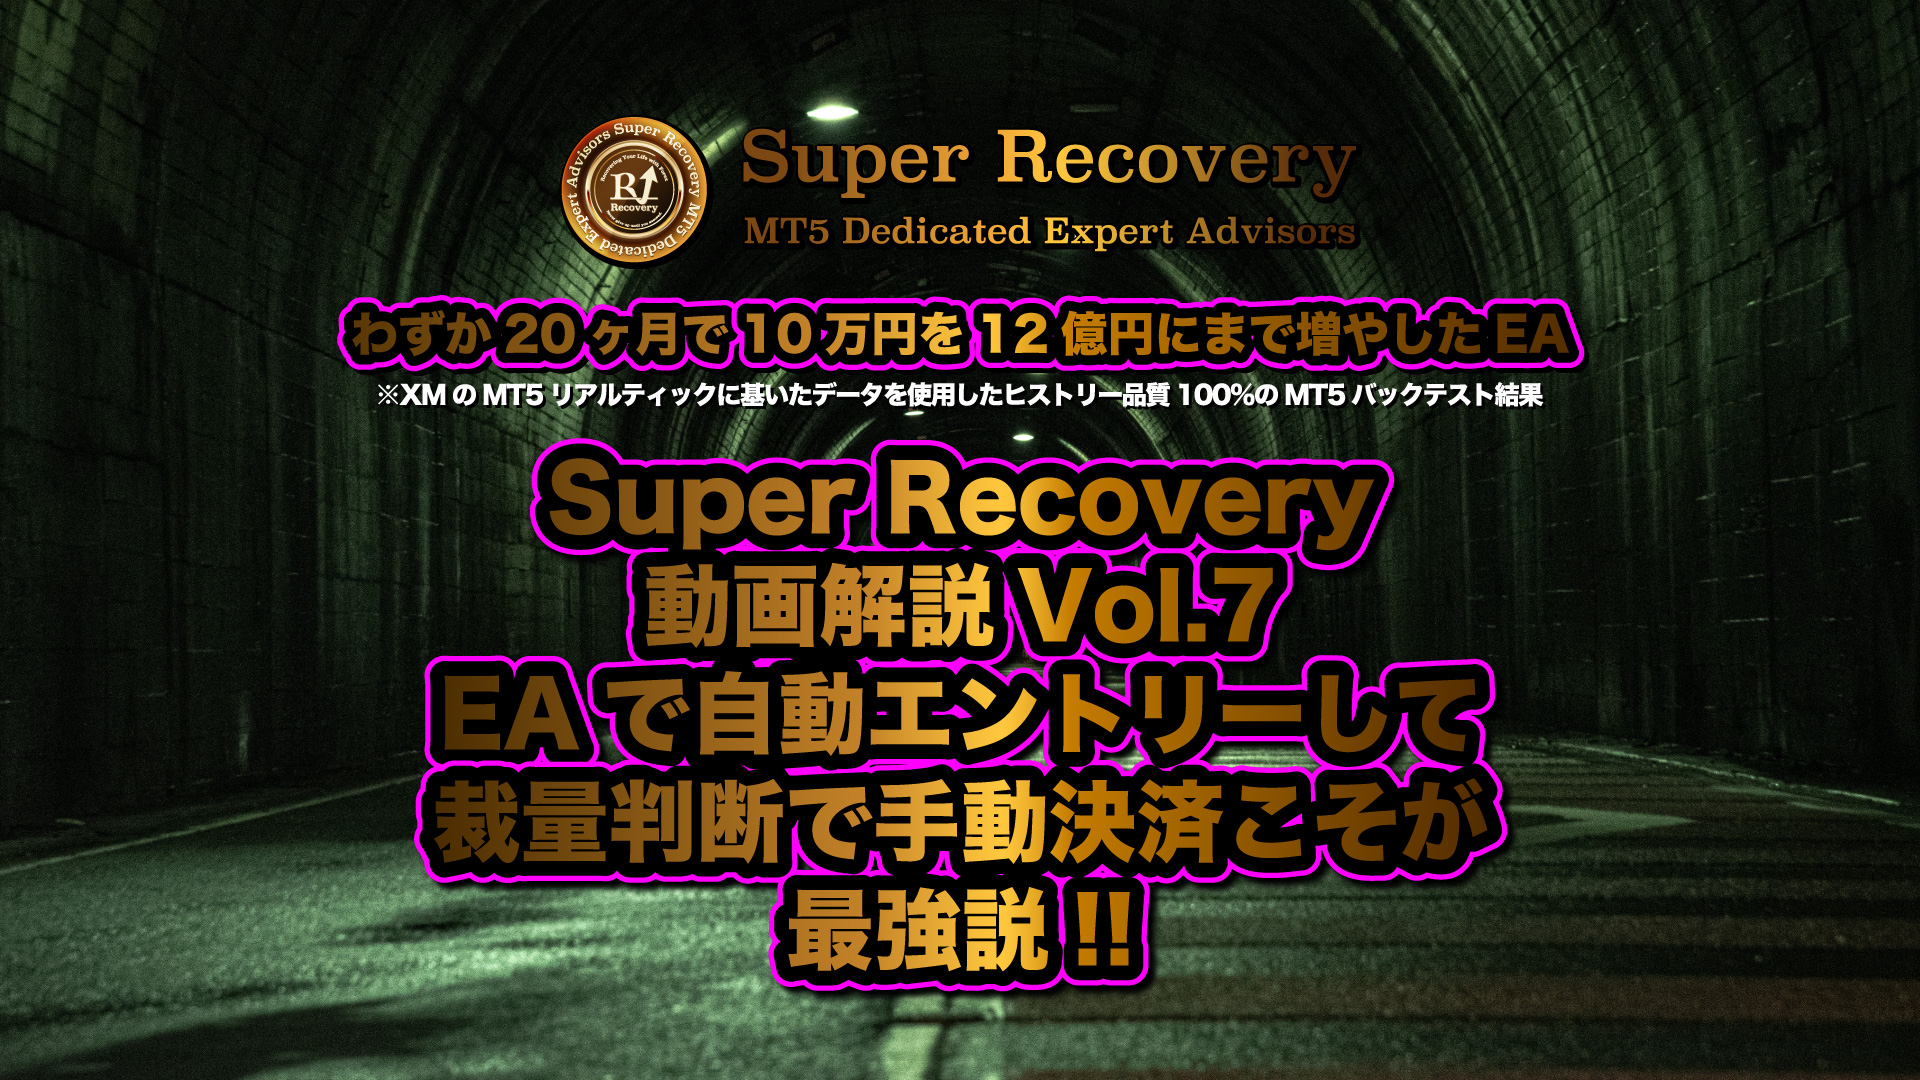
Figure 1 shows the trading history of the pyramedding method.
The yellow numbers indicate the order of entries.
When viewed in chronological order, when the price rises, the long position is increased in steps.
If there are unrealized profits, add positions; if there are unrealized losses, add positions via martingale or averaging down.
Please consider the logic of Super Recovery as the same as the Recovery indicator method.
Therefore, explaining the logic of the EA called Super Recovery essentially means explaining the Recovery method of the indicator.
Thus, looking at the numbers in Figure 1, there are entries from 1 to 10.
Number 1 is the timing of the first long position, and numbers 2 through 10 are the subsequent long positions added afterward.
The timing of obtaining the 1st long position is the moment when the higher-timeframe 3-hour chart shows a long signal, and the moment when the lower-timeframe 6-minute chart shifts from a short signal to a long signal.
Thereafter, every time the 6-minute signal reverses, a long position is added.
In this case, since 10 positions were taken, there were unrealized profits.
Conversely, when the market moves against you and there are unrealized losses, positions are added by martingale or averaging down, but in most cases losses are cut before reaching 10 positions.
In a market where unrealized profits continue to increase, positions increase up to the maximum of 10; if unrealized losses continue to increase, positions remain few and cut losses.
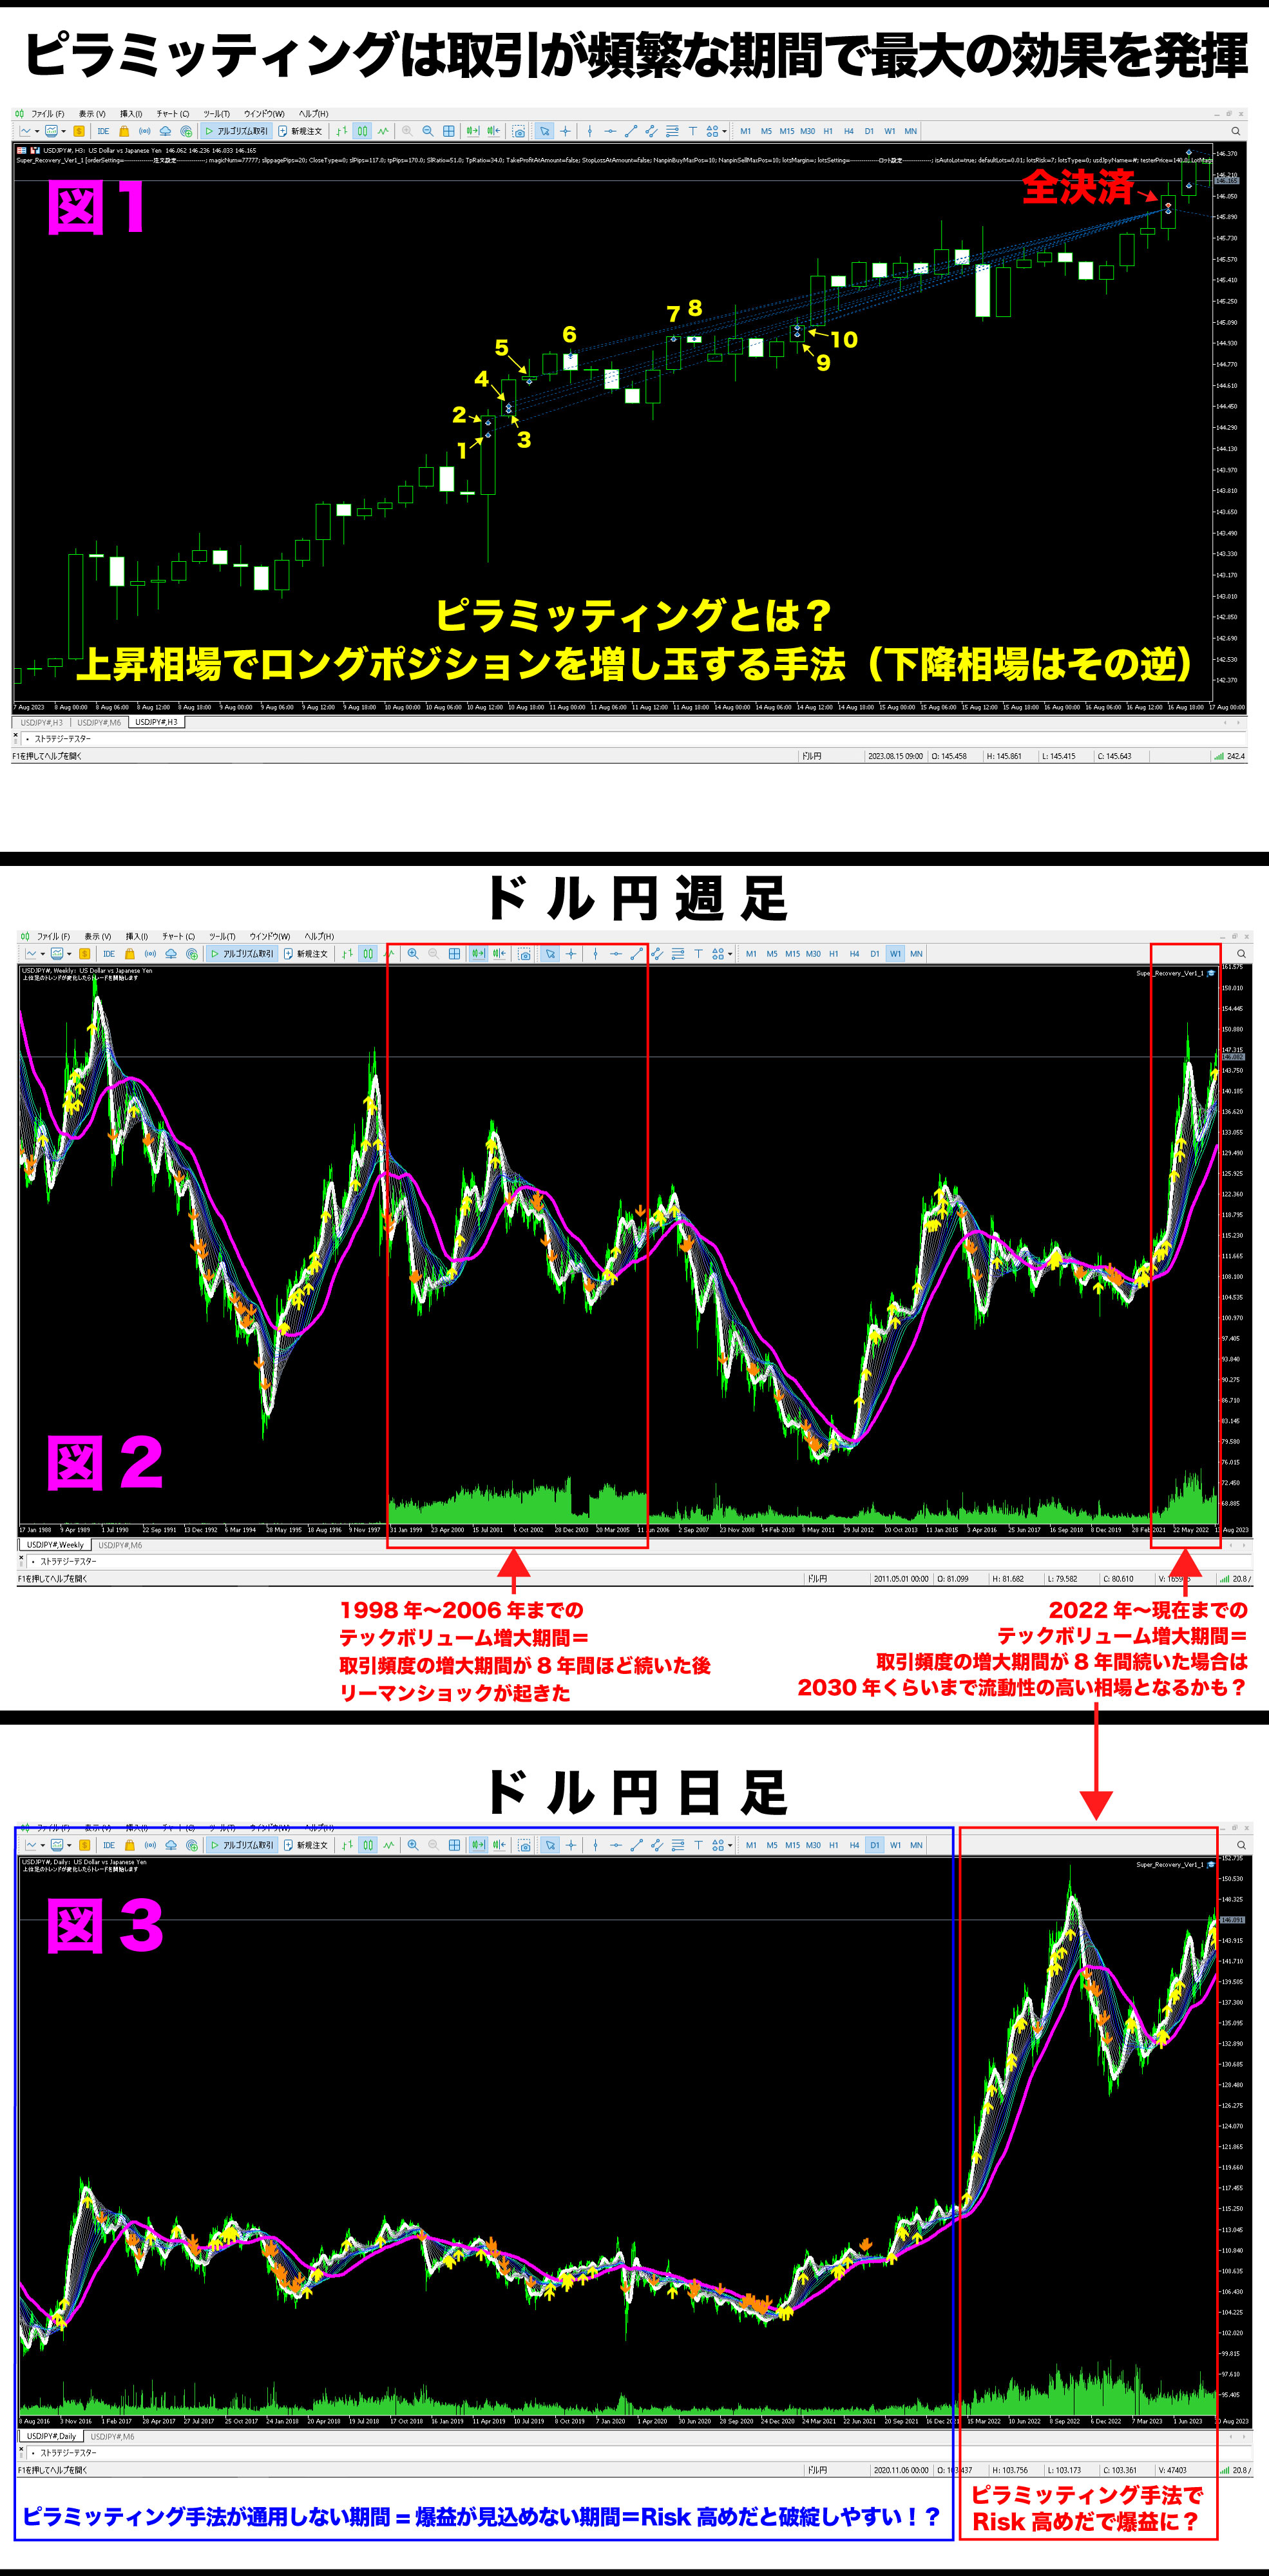
And Figure 2 shows the weekly chart of USD/JPY where tech volume has grown and trading frequency has surged during a certain period.
In the period from around 1998 to 2006, tick volume increased and trading frequency became active in the market.
After that, the Lehman Shock caused a sharp decline in the market.
And the recent period starting from 2022 shows an increase in tick volume again.
We cannot predict whether the dollar will rise or fall significantly in the future, but liquidity has certainly become very high.
When liquidity is high, the inertia principle works, and a trend becomes more likely to appear rapidly in response to the daily chart highs and lows or the 4-hour chart highs and lows when they break.
Therefore, when liquidity is low, high-price take-profit or selling pressure tends to push prices down, making the pyramiding method less effective.
Please look at the daily chart tech volume in Figure 3.
Since around 2022, funds from手買い groups and institutional investors around the world have flowed into USD/JPY.
The surplus funds in the market are always searching for targets, and funds move significantly based on fundamentals such as interest rate differentials between countries.
As in the past, once a target is narrowed down, liquidity remains high for nearly ten years, and buying and selling frequency remains active in the currency pair.
As a proxy for that trading frequency, a metric called tick volume is displayed.
In the case of the forex market, trading volume is difficult to measure as a stock-like figure, so this kind of trading frequency indicator serves as a substitute.
In my personal view, until around 2030 the world’s focus pair is likely to be USD/JPY.
That is why the pyramiding method was incorporated into the strategy.
Many of you have likely seen markets with large trends rising endlessly, and it becomes difficult for human discretionary trading to keep buying.
When I spent ten years in a long, dark tunnel, I repeatedly sold in a rising market and blew up my account many times!
And in a rising market...
Is it going to fall soon?!
It won’t rise any more, will it?!
And in a falling market...
Will it rise again?
It won’t fall any further, will it?!
That contrarian mindset led to big losses when beautiful trends were forming.
This contrarian thinking can profit when tech volume is low by using oscillators to identify overbought or oversold conditions, but once a major trend starts, contrarian averaging down or martingale is among the riskiest methods.
The reason I advocate incorporating pyramiding into my method is the correlation with tech volume.
Therefore, even though the Super Recovery EA did not show large profits in backtests before 2022, it did not consistently win or lose.
When testing since around 2020, tuning parameters for periods with low tech volume did not yield significant profits.
Backtest results from January 1, 2020 to September 4, 2023 are shown here.
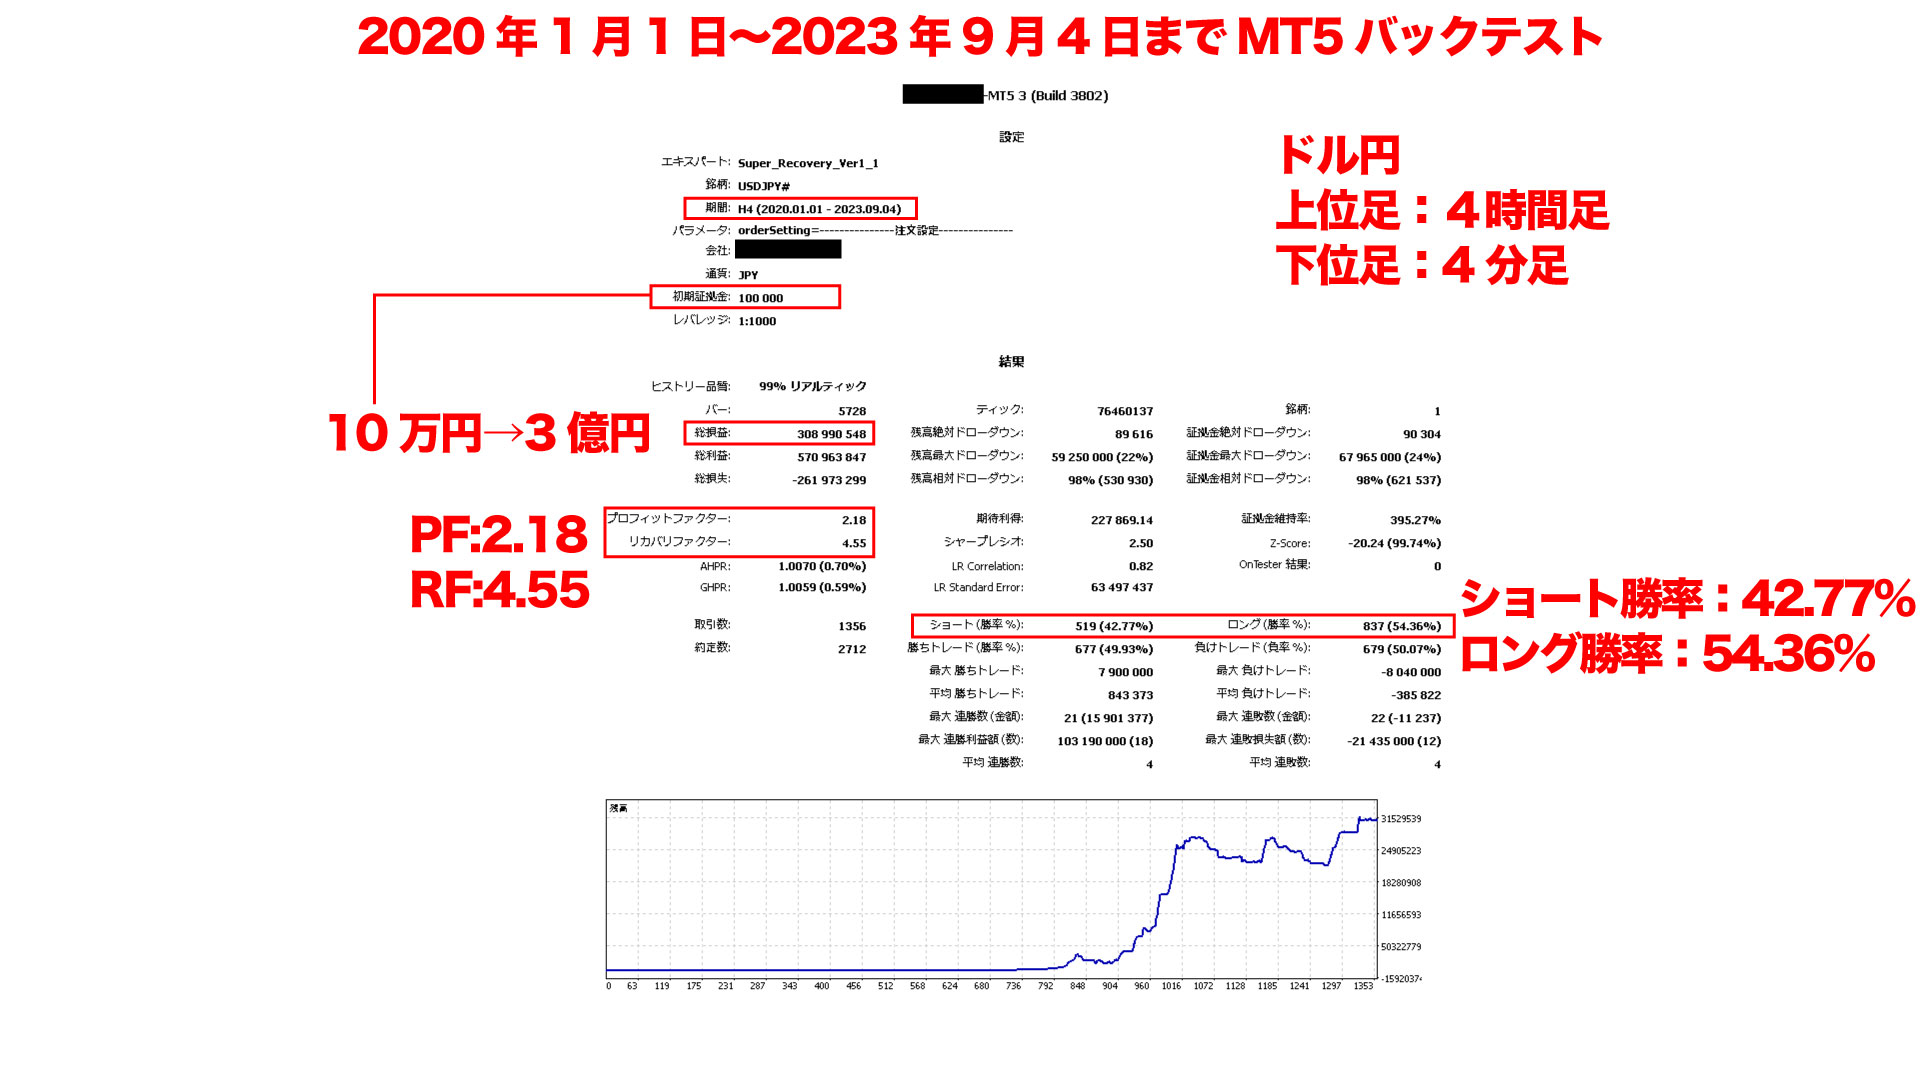
Focusing on periods of inactivity in tech volume yields low win rates and profits.
Compared with the 2022–2023 article about turning 100,000 into 1.11 billion in 20 months, this performance is quite inferior.
The previous two years show a total of 3 hundred million in 44 months historically.
In the 20 months when tick volume surged, 1.11 billion.
Which parameters would you like to trade with?
I would choose the latter without hesitation.
Thus, during periods of low trading frequency indicated by tech volume, the pyramiding method does not yield substantial profits.
With that, we will end here for today.