Ichimoku Kinko Hyo Introduction | Session 3: Three Waves and Time Relationships II [Supervised by Tetsuo Hosoda (Sansei Ichimoken Yamabito)]
[Introduction to the Ichimoku Kinko Hyo (supervised by Sadao Hosoda, Sanzai Ichimoku Sanjin) — Serialized article series (14 parts)]
・Part 1 The Origin of the Ichimoku Kinko Hyo(Free)
・Part 2 The Three Movements and Time Relationships①
・Part 3 The Three Movements and Time Relationships②
・Part 4 Things Learned from Time-Price Relationships and the Three Movements
・Part 5 Conversion Line and Base Line①
・Part 6 Conversion Line and Base Line②
・Part 7 Conversion Line and Base Line③
・Part 8 Leading Span and Lagging Span①
・Part 9 Leading Span and Lagging Span②
・Part 10 The "Pattern" of Preparatory Structure and the 9-Week Chart
・Part 11 The 9-Week Chart and the 9-Month Chart
・Part 12 The Real-Line B, Y and the Maturity Line
・Part 13 How to Use B, Y
・Part 14 Content of the Original Text of the “Ichimoku Kinko Hyo”
Table of Contents for Part 3
1. The essence of the Three Movements is Time and Price
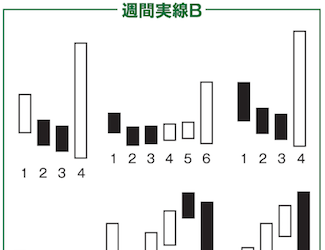
2. Classify N waves by price range
3. Three important calculation values
4. What can be inferred from achieving the calculated values
5. The same N movement can be interpreted differently
6. Along with the calculation values, the market levels to pay attention to are visible at a glance through the lines of the Ichimoku Kinko Hyo
7. Ichimoku Kinko Hyo: Fun Facts
The essence of the Three Movements is Time and Price
First, let us begin with a recap of the previous discussion that explained “the Three Movements and Time Relationships.” The Ichimoku Kinko Hyo is based on the principle that any price movement ultimately takes the form of three movements. Among those three, the N movement is the directional primary wave, while the P, Y, and S movements are intermediate waves that appear during consolidation.
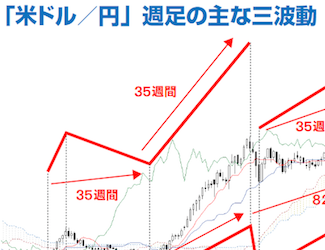
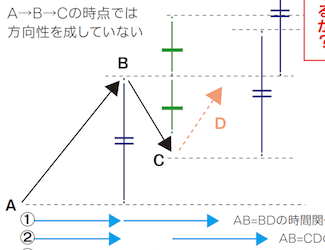
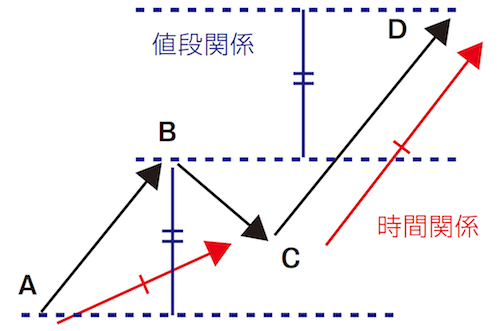
Regarding the composition of the N movement, it was explained that the first and second waves exert a temporal influence on the third wave. When prices rise (first wave) and then pull back (second wave), the time required for the third wave becomes evident from those times.
In the market there are not only short-term three movements, but also medium- and long-term three movements, and it is believed that these influence the present. By examining them comprehensively, one can read the market’s next move.
Note that the reason the Leading Span and Lagging Span of the Ichimoku Kinko Hyo are shifted about 26 days earlier than the current time is to provide a yardstick for reading time relationships at a glance. This design shows how important time relationships are in the Ichimoku Kinko Hyo. This topic will be revisited as a separate theme.
Recap of the Three Movements
① The market movement is based on three waves
② Any price movement ultimately becomes three waves
③ Emphasize three movements that include time and price relationships
From the relationship of time and price, it is necessary to identify the important three movements.
The copyright of the Ichimoku Kinko Hyo belongs to Economic Variation Research Institute Co., Ltd., which publishes the original work. For information on purchasing the original, please visit the official Ichimoku Kinko Hyo website.
Service | Official Ichimoku Kinko Hyo website | Economic Variation Research Institute Co., Ltd.