Ichimoku Kinkōhyo Introduction | Episode 1: The Origin of Ichimoku Kinkōhyo [Supervised by Tetsuo Hosoda (Sansei Ichei Sanyo)]
A Project to Know the Real Ichimoku Kinko Hyo
In this new series starting with this installment, under the supervision of Tetsuo Hosoda, also known as the Sannin Ichimoku Yamanjin, we will attempt to organize the “proper way to use” of the Ichimoku Kinko Hyo.
【Introduction to Ichimoku Kinko Hyo [Supervised by Tetsuo Hosoda (Sannin Ichimoku Yamanjin)] Serialized Articles (Total 14)}}
・Episode 1: The Origins of Ichimoku Kinko Hyo(Free)
・Episode 2: Three Motions and Time Relationship I
・Episode 3: Three Motions and Time Relationship II
・Episode 4: What Can Be Understood from Three Motions and Time Relationships and Price Relationships
・Episode 5: Conversion Line and Base Line I
・Episode 6: Conversion Line and Base Line II
・Episode 7: Conversion Line and Base Line III
・Episode 8: Leading Span and Lagging Span I
・Episode 9: Leading Span and Lagging Span II
・Episode 10: The “Pattern” of Preparatory Structure and the 9-Week Chart
・Episode 11: 9-Week Chart and 9-Month Chart
・Episode 12: B and Y on the Weekly Real Line and the Balance Line
・Episode 13: How to Use B and Y
・Episode 14: The Contents of the Original Book of “Ichimoku Kinko Hyo”
How do you use Ichimoku Kinko Hyo? Some may use the Leading Span (Cloud) as resistance, or use the three signals of bullish/bearish reversing, etc.—there seem to be many ways. However, those common usages only capture one aspect of Ichimoku Kinko Hyo, and in terms of its fundamental meaning, they may be somewhat off the mark.
Then, how different are the uses of Ichimoku Kinko Hyo between the original author and the general use? It will become clear by looking at the chart analyses by Sannin Ichimoku Yamanjin. At first you may be puzzled by “What is this?” But the aim of this series is to understand each meaning with you and eventually approach the authentic usage by the author himself.
Sannin Ichimoku Yamanjin says that it’s fine to progress by steadily accumulating what you understand. Behind that statement may lie the truth that there is no easy way to acquire knowledge.
Also, at the start of this project, we received materials left by the inventor of Ichimoku Kinko Hyo, Soichi Hosoda (see the next chapter “Exclusive Access! This Is the Origin of Ichimoku Kinko Hyo”). The Ichimoku Kinko Hyo that we casually use today, as shown in the photographs, was devised after extensive research.
The copyright of Ichimoku Kinko Hyo is held by Economic Fluctuation Research Institute Co., Ltd., which publishes the original. For information on purchasing the original, please visit the Ichimoku Kinko Hyo official website.
Services | Ichimoku Kinko Hyo Official Website | Economic Fluctuation Research Institute Co., Ltd.
Exclusive Access! This Is the Origin of Ichimoku Kinko Hyo
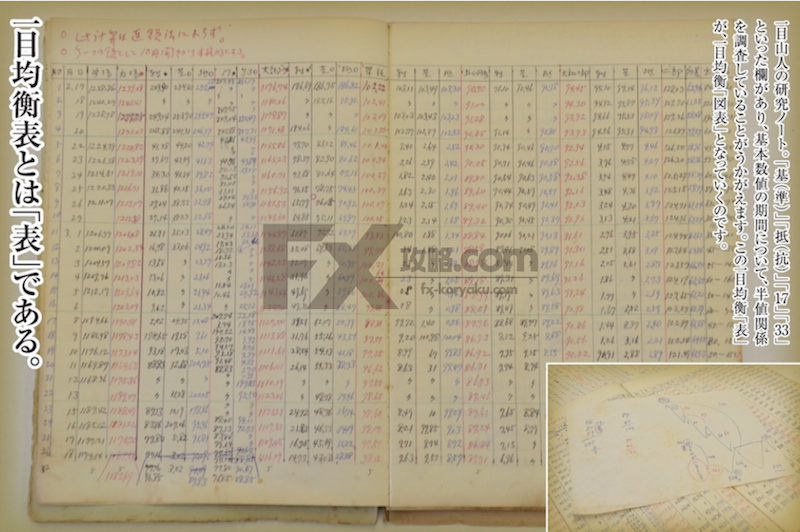
Hosoda Yamanjin’s research notebook. It has sections such as “Base (Preparatory),” “Resistance,” “17,” and “33,” suggesting that the researcher studied the half-value periods of basic numbers. This Ichimoku “table” would become the Ichimoku “chart.”

What appears to be the modern lines such as the Conversion Line and Base Line can be seen. Still, even Sannin Ichimoku Yamanjin had lines that he did not fully understand. It is evident that he researched many patterns of lines.

This is a document where market price movements were drawn on graph paper with glue, and the whole picture was understood by connecting them. To indicate its size, a 30 cm ruler was placed on the right side of the photo. From the actual data, one can interpret that one day was recorded as 1 mm. If one month is about 25 business days = about 2.5 cm, then the length for a year would be about 30 cm. The chart contains more than five years of data in total.
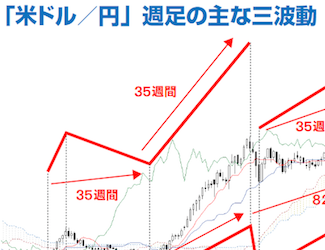
Equivalence Numbers (Time Relationship) the Sannin Ichimoku Yamanjin Checks to Grasp the Three Motions (Weekly USD/JPY)
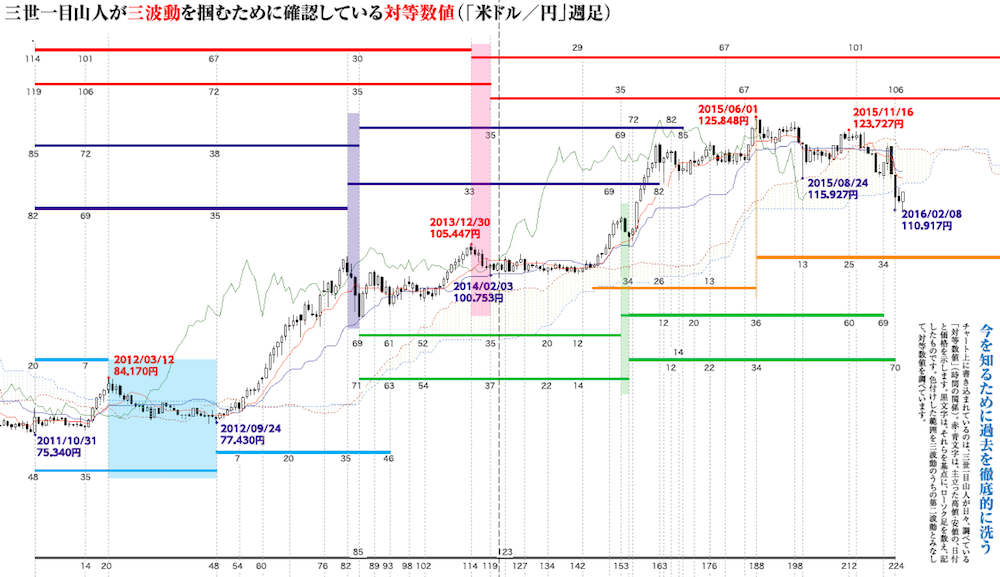
What is written on the chart are the “equivalence numbers” (time relationships) that Sannin Ichimoku Yamanjin studies daily. Red and blue text indicate the dates and prices of major highs and lows. Black text is the base points from which the candlesticks are counted and recorded. The colored area is regarded as the second wave among the three waves, and the equivalence numbers are examined.
Calculated Values the Sannin Ichimoku Yamanjin Checks to Grasp the Three Motions (Weekly USD/JPY)
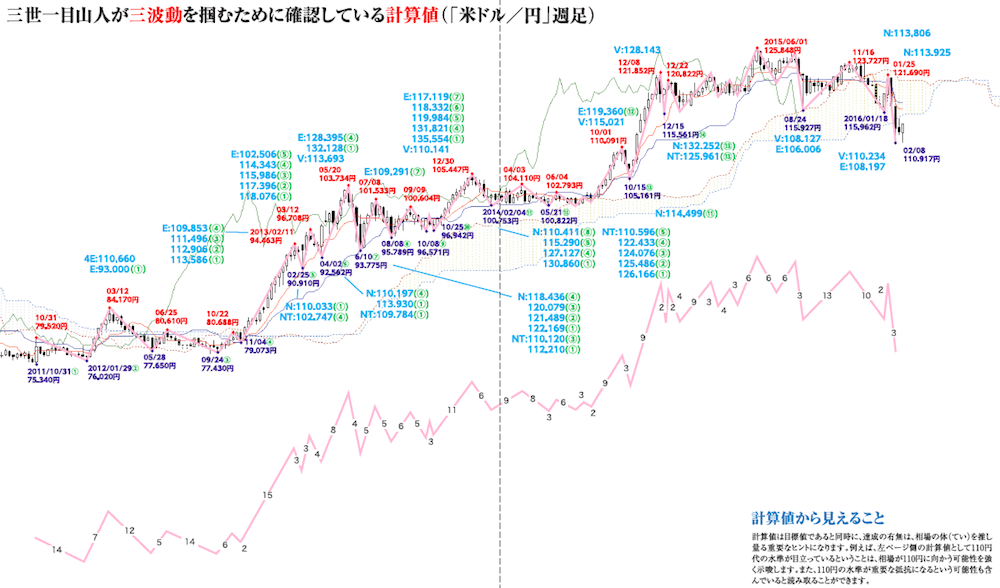
Calculated values are both targets and important clues that indicate whether the market’s condition allows achieving them. For example, if the left side of the image shows a notable level around 110 yen as a calculated value, it strongly suggests the market may move toward 110 yen. It can also be read as indicating that the 110 yen level may act as an important resistance.
Unconventional Thinking Not Widely Known: Confirming the Three Waves
To let readers know that Ichimoku Kinko Hyo is not being used in its original intended form, we deliberately publish the analysis chart of USD/JPY weekly by Sannin Ichimoku Yamanjin without detailed explanations.
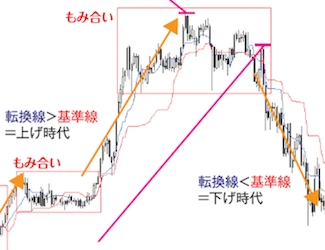
Generally, the basic idea of Ichimoku Kinko Hyo is to focus on the intersection of the Conversion Line, Base Line, Leading Span, Lagging Span, and the Real Line. However, the true essence is not to focus on these chart changes themselves, but to prioritize the market transitions that lead to those conditions. The previous chart illustrates those transitions.
According to Sannin Ichimoku Yamanjin, to grasp the three waves, you should write down equivalence numbers and calculated values on the chart and verify them daily—this is the prerequisite for correctly using Ichimoku Kinko Hyo.
The reason for suddenly presenting the intricate chart written by Sannin Ichimoku Yamanjin this time is to ignite your curiosity by clearly showing the endpoint.
Already, there are several terms not widely known, such as the three waves, equivalence numbers, and calculated values, which may have piqued your interest. Here, we summarize these terms. In the following installments, we will delve into them in more depth.
About the Three Waves, Equivalence Numbers, and Calculated Values
Market transitions are drawn as three waves

N-wave is the basic wave that determines direction = a simple wave for uptrends and downtrends.
P, Y, S waves are intermediate waves that cannot determine direction, to be recognized as fluctuations in sideways markets.
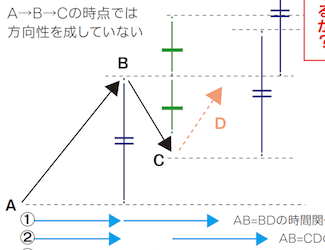
Pursuing a “Three-Wave Structure with Time and Price Relationships”

By the passage of time using equivalence numbers and basic values or by achieving calculated values, there is always the possibility that the third wave ends for the moment.
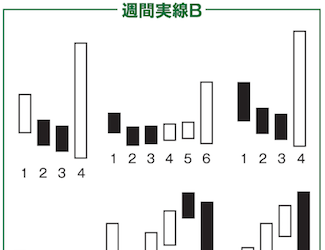
Example of Time Relationship with Equivalence Numbers

The numbers in the figure indicate the number of candlesticks, i.e., the time required for one wave.
As in this example, consider that three waves are formed.
What are Basic Numbers
Absolute numbers “9” and “26,” and the values derived from their combinations.
9, 17, 26, 33, 42, 51, 65, 76, 83, 97, 101, 129, 100 + basic numbers
How Calculated Values Are Calculated
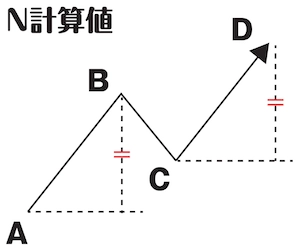
N Calculated Value: Increase the width of AB from the pullback C
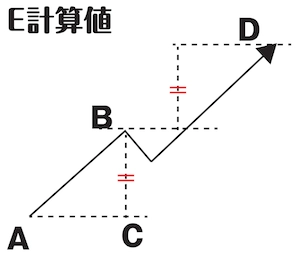
E Calculated Value: Increase the width of AB from B
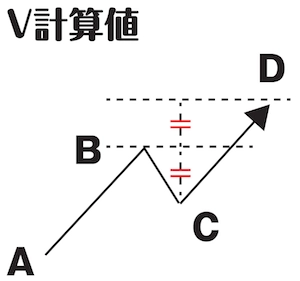
V Calculated Value: Double the width of the push
Ichimoku Kinko Hyo Quick Facts
Original Book of Ichimoku Kinko Hyo
The drawing and usage of Ichimoku Kinko Hyo were first published in 1969 (Showa 44) by Sakurayama Ichi Ichimoku Shoten (Economic Fluctuation Research Institute) in “Ichimoku Kinko Hyo.” The original seven-part work was published privately.
What is Ichimoku Kinko Hyo?
A market technique founded by Soichi Hosoda (Ichi Yamito) based on the “New Tenkai Line” published in the Tokyo Metropolitan Newspapers in the 1930s. The newspaper reporter Hosoda, wishing to capture the essence of the market on the paper, established a private research institute and developed this method.
The Outcome is Obvious
Using the conceived “Kinkei Hyo” and “Spans,” the market’s direction is obvious, hence the name Ichimoku Kinko Hyo, also adopting the pen name Ichimoku Yamanjin in the Tokyo News.
Each Line of Ichimoku Kinko Hyo ①
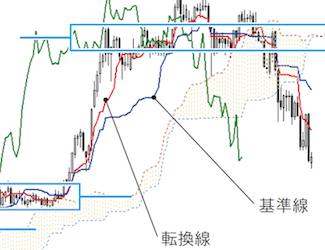
“Conversion Line” is the line formed by daily recording the midpoint of the past 9 days and connecting them. “Base Line” is the line formed by daily recording the midpoint of the past 26 days and connecting them. Ichimoku Yamanjin called these two the Kinko Hyo.
Each Line of Ichimoku Kinko Hyo ②
“Leading Span (Upper)” is the line formed by advancing the midpoint of the Conversion Value and Base Value by 26 days. “Leading Span (Lower)” is formed by advancing the midpoint of the past 52 days by 26 days. “Lagging Span” is the closing price shifted back by 26 days.
Scope of Research
In the preface of the original book, it states, “The market either moves or doesn’t. If it moves, it goes up or down.” The subject of research was what happens to a market that does or does not move, and the moment when a non-moving market begins to move, and its opposite moment.
Relative Positions of the Lines
In an uptrend, the order is: Market Real Line > Conversion Line > Base Line > Leading Span Upper > Leading Span Lower (in a downtrend, the order is reversed). From this spatial relationship, one can intuitively judge the market.
※This article is a re-edited piece from FX攻略.com May 2016 issue (Written by R. Ebizawa; Editorial Team)
Tetsuo Hosoda (Hosoda Tessei) Profile

Economic Fluctuation Research Institute Co., Ltd. Sannin Ichimoku Yamanjin. Heirs to the Yamanjin’s legacy, dedicated to popularizing the correct use of Ichimoku Kinko Hyo. He writes market commentary and technical analysis columns for the Ichimoku Kinko Hyo Club hosted by Economic Fluctuation Research Institute. Every Monday on Radio Nikkei Market Press, he broadcasts “Technical Analysis from Nikkei Average Ichimoku Kinko Hyo.”
Official Site:Ichimoku Kinko Hyo Official Website | Economic Fluctuation Research Institute Co., Ltd.