

US yield curve and US stocks
Hello, this is Nikkei OP trader of the administrator.
Thank you very much for visiting this blog.
We would like to provide information that is helpful to everyone, so please support us.
Now, the theme this time isU.S. yield curve and U.S. equities.
Below is the yield spread (red, right, %) calculated as the difference between the U.S. Dow (blue, left axis) and the 2-year Treasury yield minus the 10-year Treasury yield.
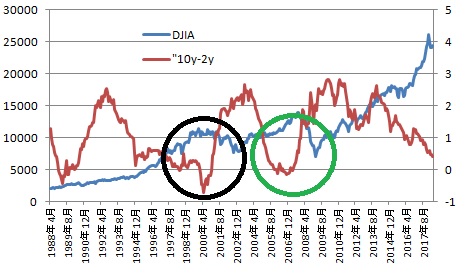
Please look at the parts circled in black and green.
When the 2-year yield is higher than the 10-year yield (an inverted yield curve), the economy is weak, and consequently the stock market also undergoes a correction, right?
Note) In 1988 the yield curve inverted as well, and afterwards stock prices corrected, but due to scale, it may not be very conspicuous.
As of June 4,
10-year Treasury yield 2.944%
2-year Treasury yield 2.520%
Yield spread 0.422%
Going forward, if the U.S. raises rates and the 2-year yield rises more than the 10-year yield, an inverted yield curve is likely.
Note) The above reflects my personal views and is intended solely to improve financial literacy. Therefore, it is not created for investment solicitation. Also, while the blog content is based on data from reliable sources, the administrator does not guarantee its accuracy. Please consider actual investment decisions as your own responsibility.

<Please click to support us. Thank you. m(_ _)m>


Is it OK?