Trends are immediately obvious; we alert you of trend reversals via alert and email with [Trend Visualizer]
I created a new indicator that displays trends and issues an alert when a trend reversal occurs.
I named it “Trend Visualizer.”
The trend determination logic is, as far as I know, original.
Trend Visualizer (alerts display and email sending available)
Features of the Trend Visualizer
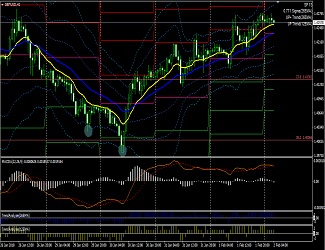
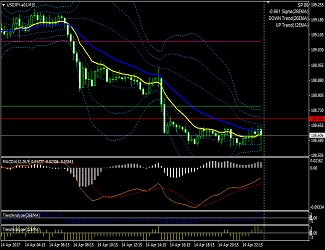
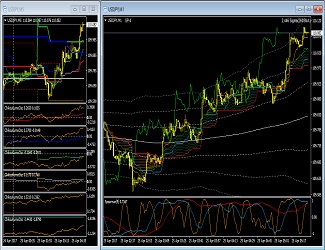
The chart below is a chart that displays the Trend Visualizer.
The Trend Visualizer has two display modes.
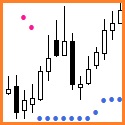
One shows the trend by displaying marks on the chart, similar to a parabola-style visualization.
The second displays by color-coding bars in a sub-window.
In other words, it comprises two indicators: one for the main chart and one for the sub-window.
The display modes are different, but the functionality is the same.
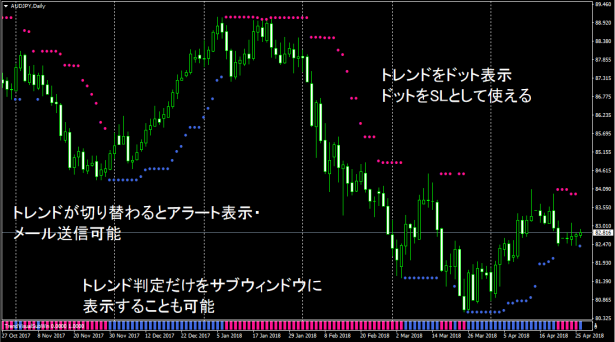
When a candlestick closes and the trend has reversed, it can display an alert dialog and send an email.
These can be turned on or off individually.
Trend judgment can be adjusted by changing the parameters for the short and long periods.
Default settings are considered sufficiently versatile, but you may fine-tune them according to your trading preferences.
In addition to the two indicator files above, the product includes a guide explaining the parameters and logic.
Trend Visualizer (alerts display and email sending available)
This article is an excerpt from the blog “The market becomes an amazing tool when you watch and place it wisely.”