
One-Click FX Training MAX Support Page
This page is a support page for purchasers.
※ Publicly available to everyone, including those considering a purchase. Please review the product features and how to use. If you have any questions, please feel free to contact us.
If you are considering purchasing the product, you can purchase from here.
https://www.gogojungle.co.jp/tools/indicators/22485The latest version is 8.33.251210.
Upgrades for purchasers are free ⇒Download Center
※ By downloading or launching this product, you agree to the Terms of Use.
▼ December 06, 2025 v8.33
Added ST button (overwrites default template chart),
First order price is based on TP/SL line
Entry time filter
Fully separate TP/SL of trailing stop
Trailing Stop: Protect, Break Even
Resume object restore parameters
Trailing Stop (AVG, SHRINK) parameter changes
Make Break Even line thickness linked to TP/SL lines
Parameterization for large 4K screens
▼ June 12, 2025 v8.26
Chandelier Exit added,
Fees display
▼ April 15, 2025 v8.22
Fast Skip
Line specification changes
▼ January 07, 2025 v8.20
AI Judgment
Synchronous charts individual scrolling
Keyboard operation included
Distribution of Object Synchronization Tool
▼ November 14, 2024 v8.18
Reset + TS addition,
Add daily/weekly/monthly, 10/100, PROFIT, PIPS/vol, PIPS/trade to trade history
Font change for messages
Change saved date to chart datetime
▼ September 09, 2024 v8.16
Error page display, stronger synchronization chart masking, add minimize start, adjust synchronization bars, BE line swap, delete limit orders on completion, add start button on launch, fix downloader, one-click SA warnings, and other bug fixes, parameter and color adjustments, etc.
▼ June 06, 2024 v8.01
Added line thickness parameter,
Added automatic lot sizing
Fix for margin and currency pair mismatch messages
Added Support Assist,
Added color bar for entry timing
Added spread to SL calculation
Added Time Leap feature,
Added resume-from-last functionality,
Added backtester for historical verification
Added Strategic Close
Added Flexible Trailing Stop
Separated TP/TS and SL/TS processing in buttons
Double-click to clear messages
Keyboard trading added
Package of perks and indicators
▼ November 12, 2023 v7.60
Next bar forward button
▼ October 20, 2023 v7.51
Add color to close message,
Click history date to display results
Other bug fixes ▼ January 29, 2023 v7.50
One-Click Auto Arrow Trade [AutoArwTrade]Support
Add buy/sell settlement to signal linkage
Display profit and loss and size in history
Speed up signal linkage
Add credit to profit/loss calculation
Add first-time server order
Change minimum RR to 0.1
TP/SL line shown at order time as well
Add parameter for initial position of control box
Auto-generation of active synchronized charts
▼ April 22, 2023 v7.30
ASP comments fix
▼ April 12, 2023 v7.281
Activate synchronized charts
Save to a predefined template chart
Fix choppy position bar
Display and comments etc. fixes
▼ March 11, 2023 v7.11
Add WebRequest to license authentication,
ASP regulation support,
Auto Numbing button
Font size scaling
Add speed list
Support multiple signals,
Slack notification 2022-09-16 v7.010 bug fixes, etc.
▼ September 04, 2022 v7
Added limit order entry
Added automatic risk calculation
Gross profit percentage (risk%) on margin
Daily P/L percentage display, trade history display
Position information display
Added risk-reward
Changed the display of position triangles
Daily aggregated image auto-save
Right edge shift for synchronized charts
Added corrected risk% calculation
▼ April 16, 2022
On full-close, reset TP/SL/TS flags
Fixed NONE bug in triangles
▼ October 15, 2021 v6
Immediate position display on entry
Invalid values for control of TP/SL via tools
Reject entry when negative
LINE, Discard notifications added
Change triangle color to a midpoint between BUY/SELL
Added initial parameter values
Message display area for errors, fills, etc.
Reduce load during speed control
Support for some fee-bearing accounts
▼ June 02, 2021
Forced loss-cut line added
Prevents repeatedly opening settings screen when tapped rapidly
TP/SL line drag & drop support
Sub-panel added
Individual settlement, partial settlement added
Active template chart change support
Compact mode added
Signal linkage (index) parameter added
Signal linkage (object) close added
Included free version of signal linkage indicators
Toggle signal linkage ON/OFF
License authentication added
▼ August 08, 2020 added
Signal tool linkage
Auto-save of trade images
Change control box color to your preference
Break-even line
TP, SL lines
Change display to PIPS
Parameter整理
PIPS-based line bundle PipsGrid
Position display on synchronized charts
SL standard/trail
Auto Namping at SL
Line at specified percentage of funds
▼ May 25 addendum
ASK line pseudo to show profit/loss easily
Add auto-off for trailing stop
▼ May 1 addendum
Disable TP/SL at order time by 0
For profit maximization, turn on trailing at order’s limit
Add PIPS display to profit/loss
Show negative in red
Add currency name to ALL and RESULT in profit/loss
▼ March 27
Show current spread (including real version)
Display order price and stop loss as triangles for quick view
Add order and stop order indicators in tool controls (including real version)
Add MA, BB, SAR to trailing stop
Add time offset and daylight saving setting to time display
Add synchronization scaling for other charts
Add dedicated templates
※ This page also includes images from before version upgrade
■Product contents
One-Click FX Training MAX is a high-function FX simulator that lets you practice and test discretionary trading even on weekends when markets are closed. It can be practiced 24/7, 365 days a year.
In addition to basic features like speed control, automatic setting of TP/SL orders, and limit orders, it includes replay functionality, signal tool linkage, partial settlements, auto risk calculation, history saving, automatic trade image saving, daily aggregates, time-leap, restart, rich display features, and more, making it a robust practice and testing tool.
From daily practice to tool testing and technical analysis, it can be used for a variety of purposes.
- Product contents
- Initial setup
- Preparing historical data
- Launching One-Click FX Training
- Operations & parameter settings
- Details of features
- Automatic calculation by risk %
- TP/SL lines
- Limit orders
- Strategic Close-StrategicClose-
- Flexible Trailing Stop -FlexiTrail Stop-
- Speed Control
- High-speed skip
- Past Verification Viewer -TheWorld-
- Restart -TimeLeap-
- Auto image saving
- Daily aggregate results display
- Entry assist
- AI Judgment (AI Export)
- Economic indicators
- Support Assistant
- Sub-chart synchronization settings
- Interfacing with signal tools
- Indicators included or distributed
- Troubleshooting & Tips
- When in trouble
■Initial Setup
Please refer to the setup page to allow DLLs, configure authentication, and install One-Click FX Training.
Basic setup for One-Click FX seriesOnce setup is complete, please restart MT4.
■Preparing historical data
One-Click FX Training can start and run using historical data already in MT4. However, to improve training and validation accuracy or to conduct longer-term validation, preparing historical data may be required.
We provide historical data prepared for the One-Click FX series, which you can use.
【2026 Edition】Set up MT4 historical data (historical data)■Launching One-Click FX Training
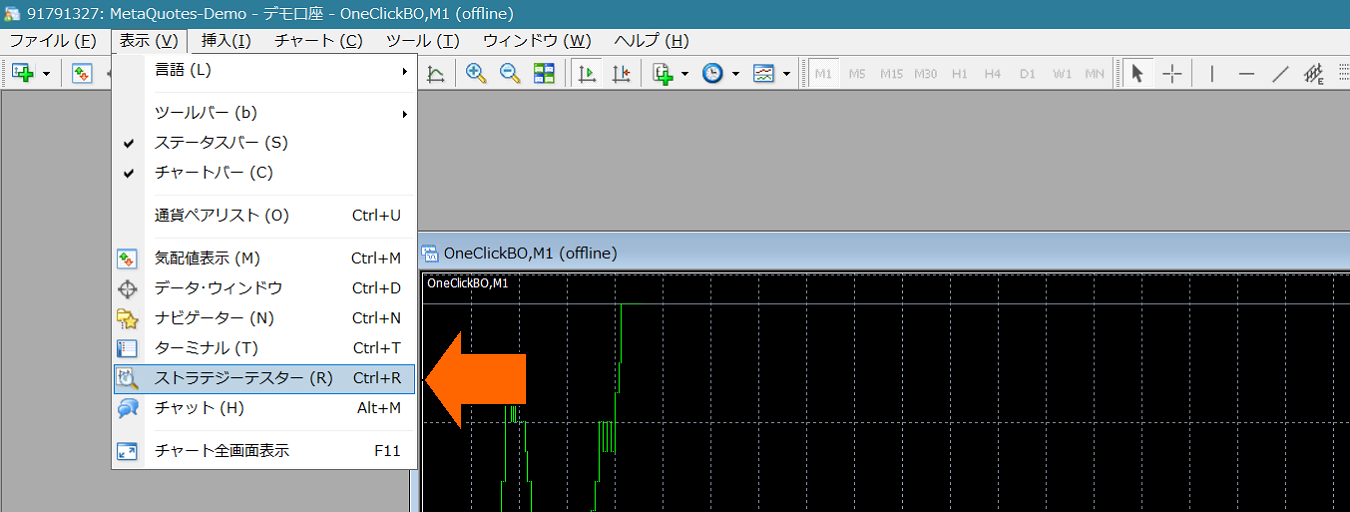
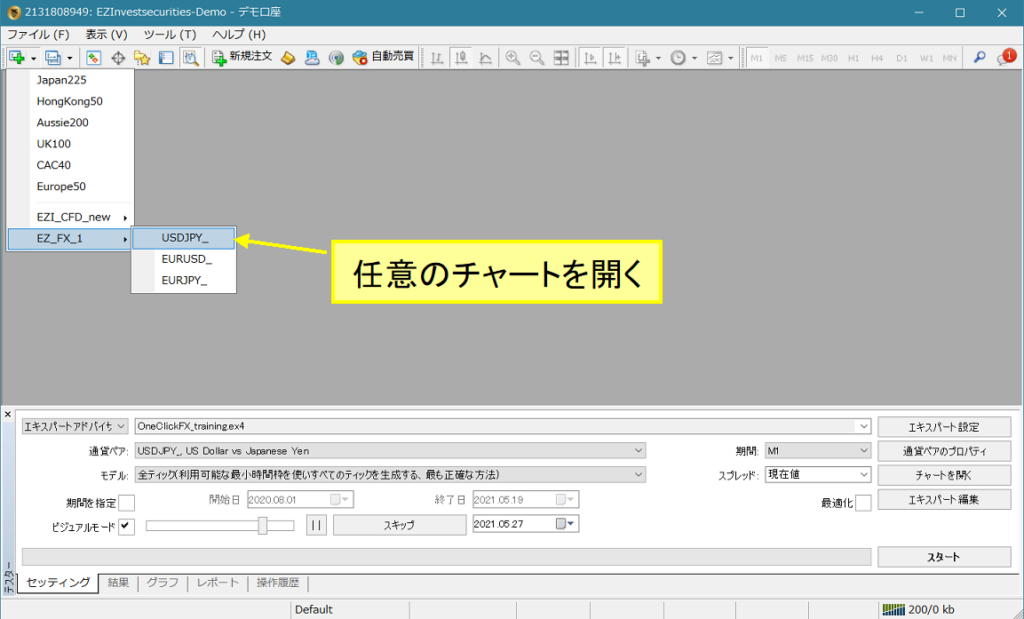
4) Open Strategy Tester window.
5) In Strategy Tester, choose Expert "OneClickFX_training", any currency pair,Model is "Control Point" (for practice such as scalping, use Real Tick)Check Visual Mode, uncheck Optimizer. Set speed slider to 31 or 32.
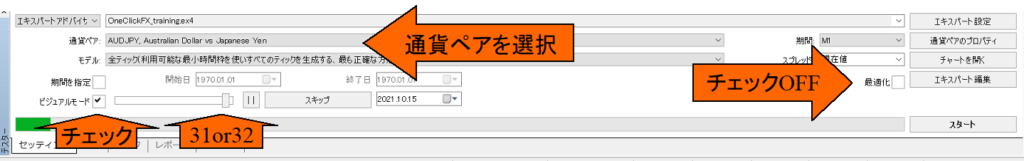
※ If Visual Mode or others are not displayed, see =>If Visual Mode, speed slider, period do not display in MT4 tester.
6) 【Important】From Expert settings,Open Parameter input screen and enter "GoGoJungle Member ID" then OKand press OK (other parameter information is explained later). Using other information may be considered unauthorized use.
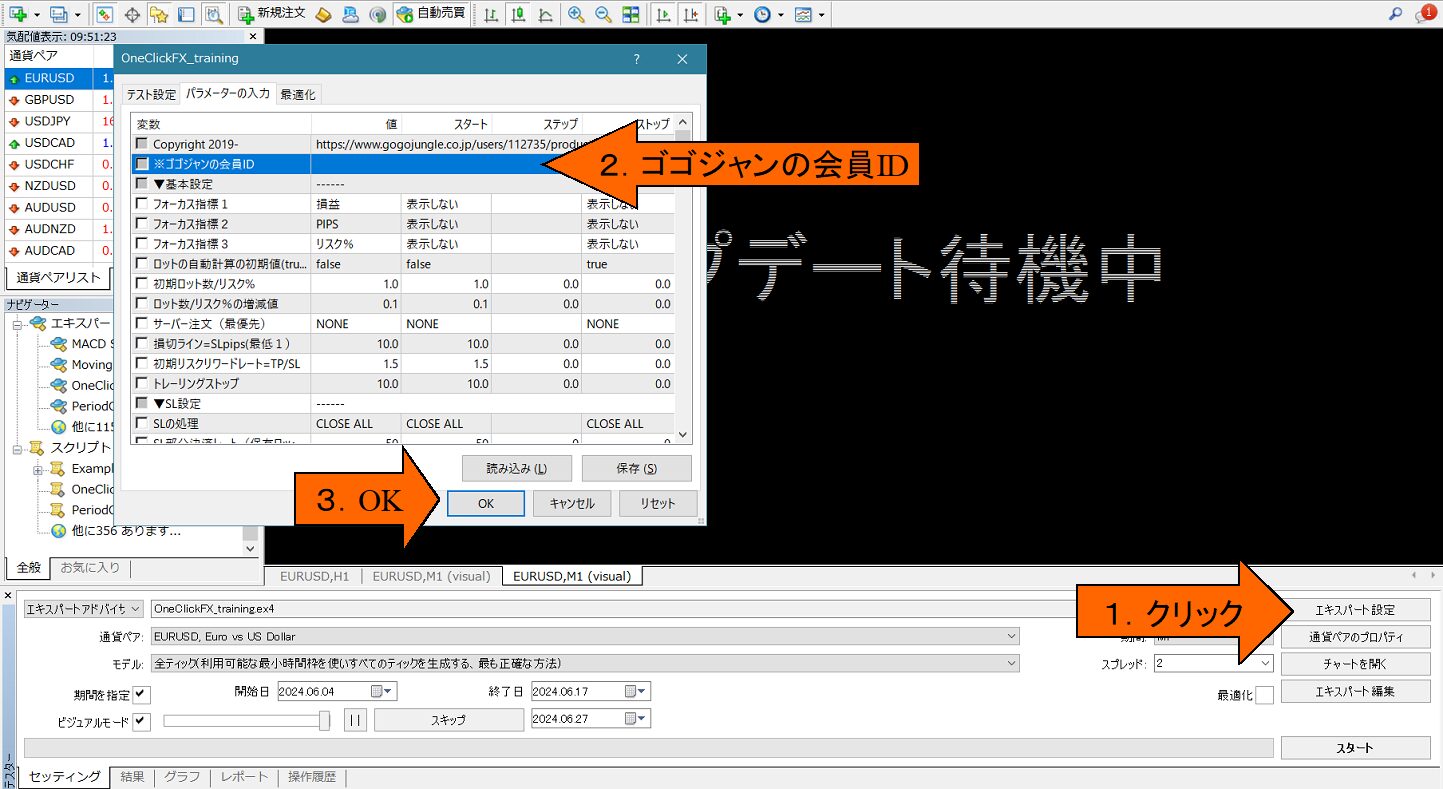
7) Press the Start button at the bottom-right of the tester window (in the image it is Stop).
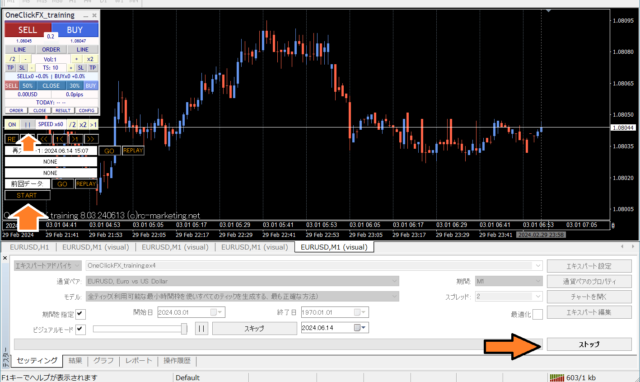
After showing "Awaiting update", the chart screen will appear. If license error occurs, recheck your email address. Press Stop to halt. From the One-Click FX Training MAX control panel at the top-left of the chart, press the pause button in the arrow area, then start again.
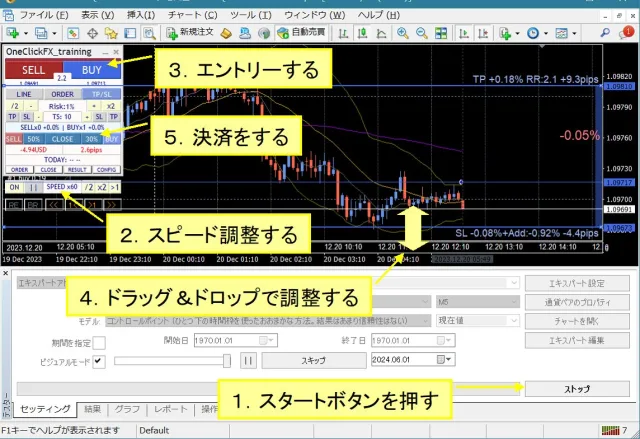
This will run with default values. Press Buy/Sell and settlement buttons to verify operation.
If it stops immediately after starting, check the error items in the operation history tab.
If you want quick simple trading practice
Change of standard chart while tester is active
Three standard charts are included.
・OneClickFX_training: The template chart automatically applied at startup. Includes original chart colors, Bollinger Bands, moving averages, PipsGrid, economic indicators, and JST display.
・OneClickFX_training_core: Simple chart with original colors and Bollinger Bands only.
In addition to these, you can change to your own or standard template charts by right-clicking > Template Chart to switch freely.

Set margin to Japanese Yen
From the Expert button, open test settings, on the right side of initial margin, directly enter "JPY" in the dropdown. Leave as is, and add two zeros to dollars to prevent capital loss.
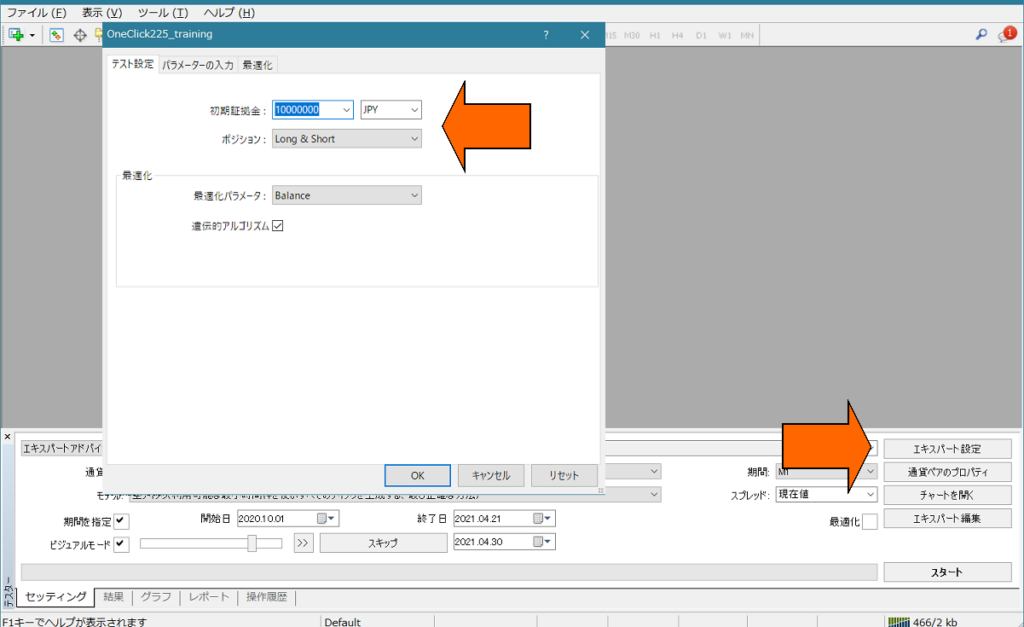
Depending on the broker, orders may be halted directly after placement if the currency pair is not in JPY. In that case, use the margin in the quoted pair.
For details =>MT4 Strategy Tester: Set the margin currency to Japanese Yen
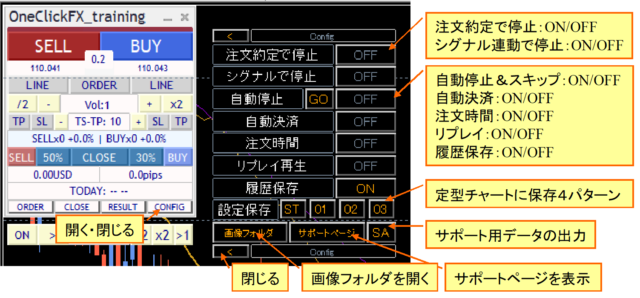
■Operations & parameter settings
How to use One-Click FX Training MAX
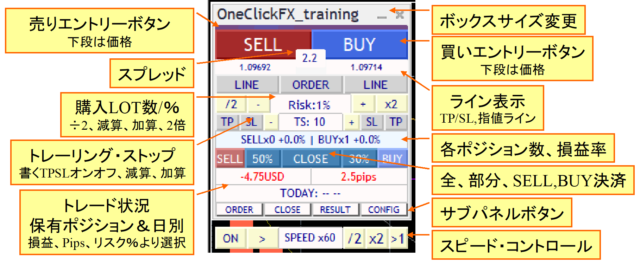
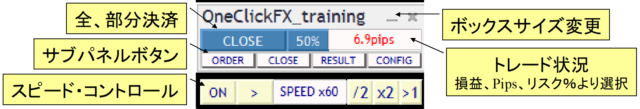
Main panel (normal mode)
Focus mode
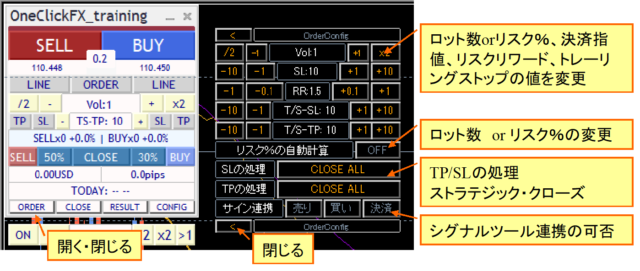
Order sub-panel
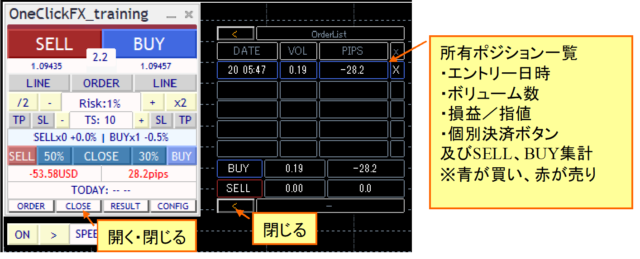
Close sub-panel
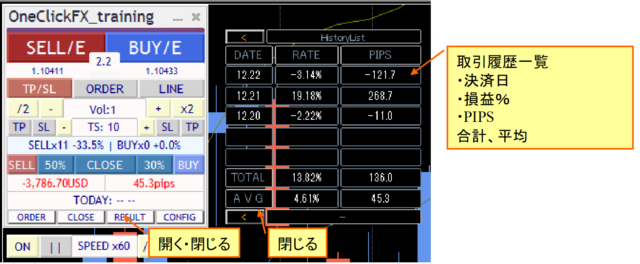
History sub-panel
Other sub-panels
Speed control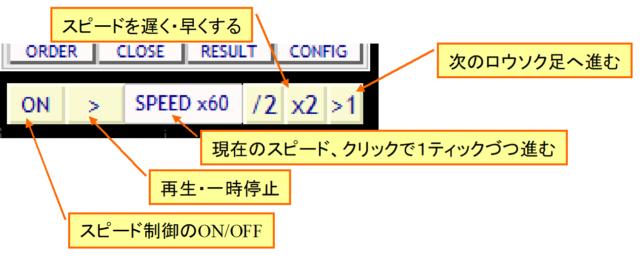
Pause-forward and restart save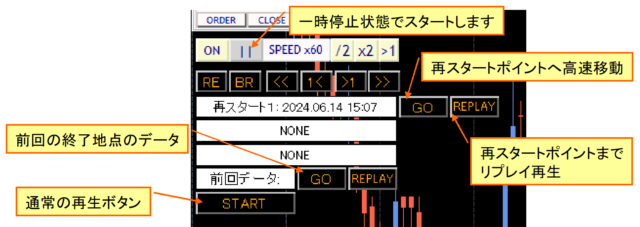
Display at start, normal start, restart, replay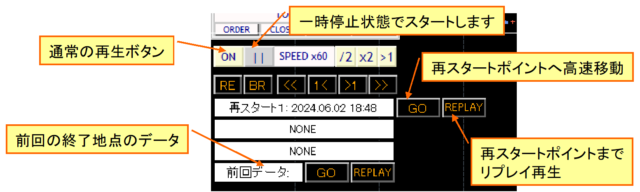
Parameter settings for One-Click FX Training MAX
| Parameter name | Description |
|---|---|
| GoGoJungle Member ID | Enter the GoGoJungle member ID for license authentication. Only purchasers can use this. |
| Focus Indicator 1, 2, 3 | You can select three indicators for Profit/Loss, PIPS, and Risk% respectively. Indicator 1: Left of control box, Indicator 2: Right of control box, Focus mode, Indicator 3: Right edge center of chart (NONE to hide) |
| Initial value for automatic lot calculation | If you auto-calculate lots from Risk%, set true |
| Initial lots / Risk%, Increment | Set initial values and increments for lots or risk% |
| Server orders | Choose whether the TP/SL shown by lines, or only SL (Stop) are ordered on the server. The initial TP/SL and initial SL are set only at the first order; changing TP/SL lines afterward will not modify the order contents.If server orders are ON, all Strategy Close lines will be disabled. |
| Stop-loss line = SLpips (minimum 1) | Specify the initial PIPS from the Break Even line to the forced sale (Stop). The spread is not included in this value. The settlement stop will be the specified stop + spread. |
| Risk-Reward | Specify how many times the distance between Break Even and settlement stop to set the initial TP. For example, if SL is 100 and Risk-Reward is 1.5, the initial TP is Break Even line plus (100 pips + spread) × 1.5. |
| SL/TP Trailing Stop | Trailing StopTrailing Stop is automatic progressive settlement controlled by the tool. Specified in pips. |
| ▼ SL settings (Stop-Loss order) | |
| SL handling | If the Stop-Loss is reached, specify how Strategy Close should handle it. |
| Partial SL rate (holdings in %) | Specify percentage for partial settlements. |
| Type of SL trailing stop | Trailing StopChoose the type of trailing stop. |
| ▼ TP settings (Take Profit) | |
| TP processing | If TP is reached, specify how Strategy Close should handle it. |
| TP partial settlement rate (holding lots %) | Partial settlement percentage |
| TP trailing stop type | Trailing StopType of trailing stop. |
| ▼ Individual settings | |
| Turn TP/SL lines ON when orders are placed/filled | TP/SL lines are initialized when you press the order button. If you turn TP/SL lines OFF after placing a limit order, they will turn ON again when the order fills. |
| Strength of Entry Assist | Entry AssistConfigure Entry Assist. Default is disabled. |
| Force settlement from keyboard input | Typing the specified keys will settle all. Default is off. You can choose any combination of SHIFT+CTRL+ALT to settle. Keys may vary by keyboard layout; please try beforehand.Advancing speed limit will drop. |
| Maximum number of positions | Limit the maximum number of positions you can enter. Some brokers also have limits. 0 means unlimited |
| Maximum size of one position (0 = unlimited) | Automatically split order size for entries. |
| Use ASK line | Emulate ASK line with BID line. If false, adjust for spread and display as normal line. Note: large spread fluctuations may cause inaccuracies. |
| Tolerance slip page | Specify tolerance for slip in points |
| PIPS=>Points conversion factor | Specify the value to convert from PIPS to points. For FX, zero auto-setting is fine. For CFDs, adjust per broker. |
| Forced settlement time Forced settlement initial value |
Change as needed. If a position exists, settlement occurs at the specified time and pauses. Default true means ON |
| Order time Start time, end time Order time initial value |
Specify allowed order times. From start to end, entry orders will be sent to the server. Outside these times, entries via button are not accepted. Settlement orders and limit orders are not included. Default true means ON |
| Initial speed index | Specify which speed in the speed control speed list to start with. |
| Speed list | Specify speed multipliers comma-separated. 60 means 1 second = 1 minute, 3600 means 1 second = 1 hour, up to 604800x = 7 days. Note: cannot exceed Strategy Tester max speed. If speed control is OFF, speed is the speed set in the tester (max playback). |
| Initial value for instantaneous speed after order | Pause on execution via speed control. Resume using speed control playback or ON/OFF button. |
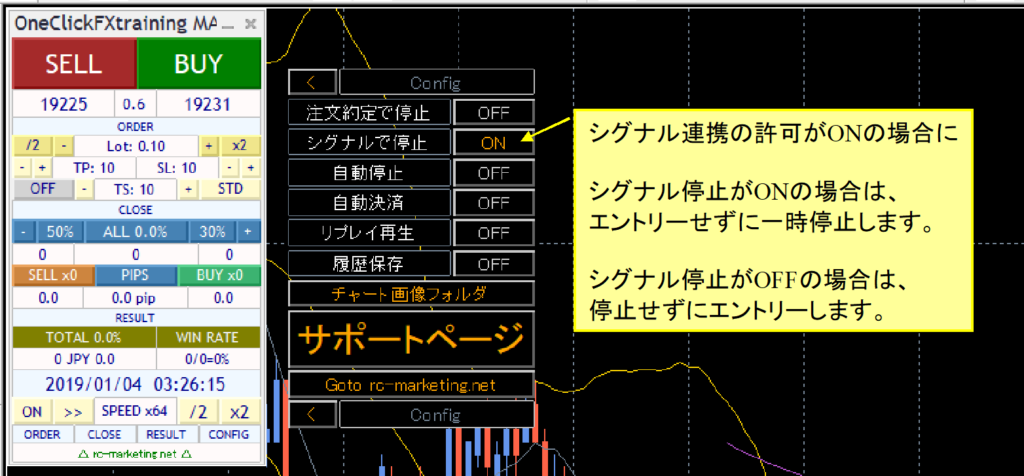
| Initial value for pause on signal | While signaling is active, pause via speed control without entering orders. Press playback or ON/OFF to resume. |
| Automatic stop time | Change the initial value if needed. Chart stops automatically at that time. Works in charts with H1 or lower. Default true means ON |
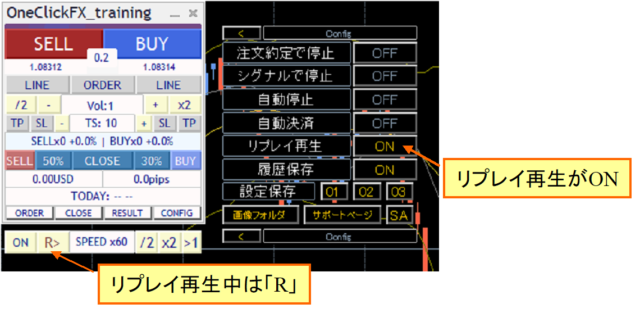
| Replay initial value | ON if true |
| History saving initial value | ON if true |
| Reaction speed (milliseconds) | The basic unit for chart operation and synchronization. Usually no need to change, but if using large monitors or 4K+, adjust to reduce lag. Values around 10-100 feel natural. |
| Preserve template chart objects | When changing a template chart, keep the original objects (like trendlines). If you want to resume including objects from the saved point, set true. |
| ▽ Display settings | |
| GMT offset of connected server Daylight saving time |
If MT4 shows as is, keep as is. To set to JST, change offset to 2 and enable DST (depends on the connected server, please confirm). |
| Show final time | Display final tick time in the control box. If server time offset is adjusted, display the adjusted time. |
| Trade image saving Image size width x height |
Configure when to capture images on execution and daily totals. Choose not to capture, full screen, or target chart. After tester ends, open the saved image folder. Images are overwritten each time, so copy elsewhere if needed. |
| Show trade history marks | Display MT4 standard triangles and lines for entries and settlements |
| ▽ Output settings | |
| Specify the maximum number of bars for AI output data. Note: number of candlesticks | |
| AI output bar margins | Specify the number of extra bars before/after AI output data. |
| ▼ Settings for Signal Tool linkage | |
| While linkage is active and you hold a position, if a signal opposite to your position occurs, specify handling: enter new hedge, close current position, close then enter (reversal), or do nothing. | |
| Initial values for buy signal enabled Initial values for sell signal enabled Initial values for settlement signal enabled |
Initial values for linkage ON (true) or OFF (false). |
| ▼ Signal Tool linkage (Object) | |
| Buy signal object name Sell signal object name |
Enter the object names displayed by the signal tool. If they partially match, they are considered the target signal. Default: ArwUP, ArwDN are used byOne-Click Auto Arrow Trade and included Signal Arrowization Tool as default arrow names.You can specify multiple strings separated by commas. All conditions must be AND. |
| Signal time target | Specify whether the target is the latest bar (0) or a past bar (1–). If painting on the latest bar, enter the confirmed previous bar (1). |
| All settlement signals object names Buy settlement signal object name Sell settlement signal object name |
Enter the object names displayed by the signal tool. If they partially match, they are the target signals. Defaults: ArwCL, ArwCUP, ArwCDN correspond toOne-Click Auto Arrow Trade and included Signal Arrowization Tool arrow names. Align with arrows’ names. |
| Settlement signal time target | Specify latest bar (0) or past bar (1–). If painting uses latest bar, enter previous confirmed bar (1). |
| ▼ Signal Tool linkage (Index) | |
| Enter the indicator file name used by the target signal tool. | |
| Buy signal index Sell signal index |
Enter the index numbers used by the indicators. |
| Signal time target | Latest bar (0) or past bar (1–). If painting on latest bar, enter previous confirmed bar (1). |
| Indicator parameters 1–8 | Enter indicator parameters in correct types (integer, decimal, string) in order. Values after END use defaults. If a parameter is a number in a string parameter, prefix with a single quote. |
| ▼ Notification features | |
| Notification settings [Common] | |
| true: start minimized. false: start in normal size. | |
| Size depends on screen; if not fitting, reduce the values. | |
| Specify the control box position. | |
| Fine-tune the control box font size. Depending on display size and Windows scaling, MT4 font size may be too large or small; adjust with this value. 1 is normal size. | |
| Specify the text size displayed on the chart. | |
| Specify thickness of TP/SL lines, Break Even line, etc. Dashed lines when not confirmed are fixed at thickness 1. | |
| Specify size and display time for messages shown at bottom-left of the chart. | |
| You can freely set colors for all control box buttons, labels, text, etc. | |
※ Only the values of parameters are used. Start, stop, and step are not used.
■Details of functions
Automatic calculation by risk %
Order quantity is automatically calculated from the margin you hold and your risk% (risk percentage).
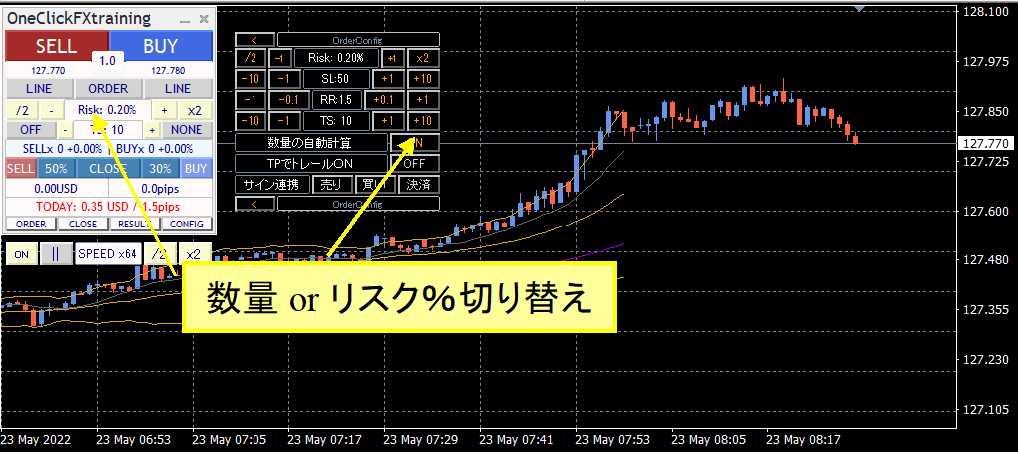
You can toggle via the control box quantity field or the sub-panel "Automatic quantity calculation".
If you place a market order without TP/SL lines displayed, the order quantity is calculated from the SL initial value and the specified risk%. If TP/SL lines are displayed, calculation uses the line price and current price to determine quantity.
For limit orders, when TP/SL lines are not displayed, quantity is calculated from the order price and initial SL; when TP/SL lines are displayed, quantity uses the order price and SL line price. Note: turning TP/SL lines on/off resets initial values and may cause auto-calculated order quantities to differ from SL line.
TP/SL lines
Use the LINE button on the control box to display TP/SL lines.
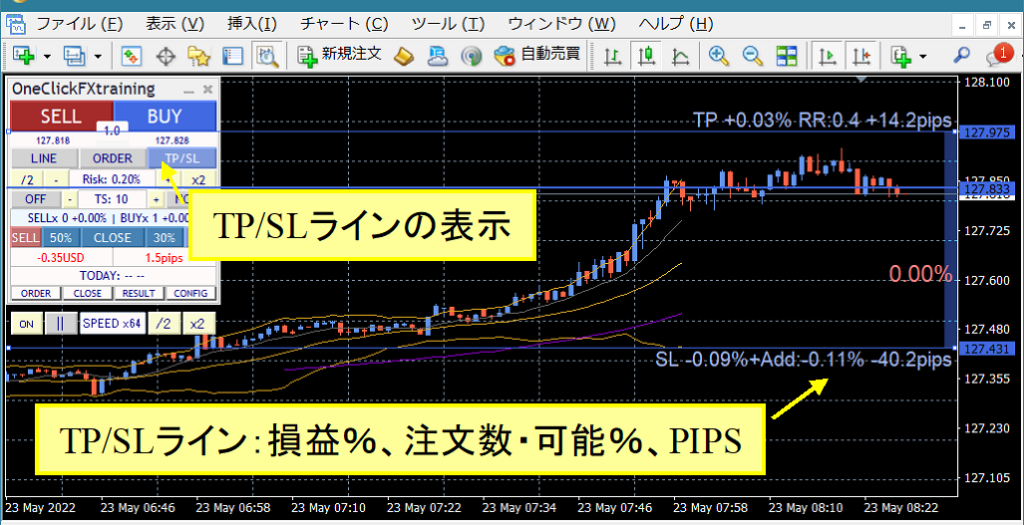
If you hold a position, at settlement you’ll see profit% and either the order quantity or risk% available to order, and PIPS from the Break Even line. If you hold no position, you’ll see orderability % and PIPS from current price.
When LINE is ON, TP/SL lines are drawn from initial values. Turning LINE on/off resets to initial values.
If TP/SL lines are OFF, no settlement occurs.
Limit orders
Use the control box ORDER button to display limit order lines.
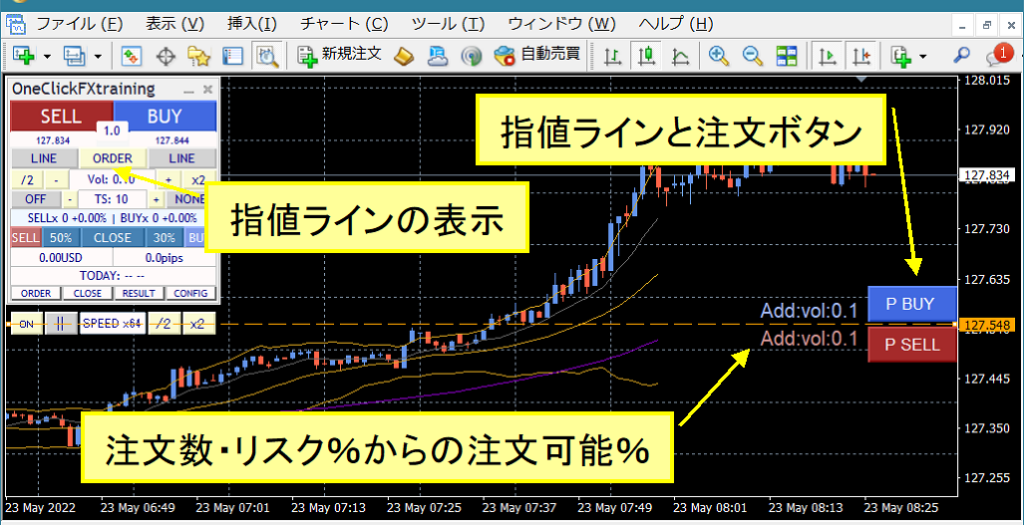
Order button shows when TP/SL lines are displayed for BUY/SELL. If BUY TP/SL line is not displayed, the P BUY button will not show. Next to the button, you’ll see either order quantity or orderable % from risk%. If n/a, you cannot add orders.
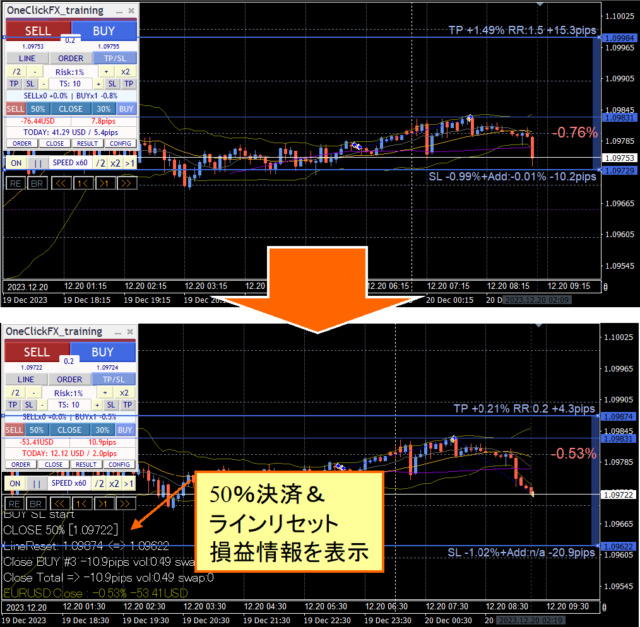
Strategic Close - StrategicClose -
When TP/SL lines contact, Strategic Close can activate several actions:
| CLOSE ALL | Close all |
|---|---|
| TrailingStop | Trailing Stop ON |
| LineReset | Reset TP/SL lines |
| CLOSE Specified%, TrailingStop | Partial close by specified % + Trailing Stop ON |
| CLOSE Specified%, LineReset | Partial close by specified % + TP/SL line reset |
| CLOSE Specified%, LineReset, TrailingStop | Partial close by specified % + TP/SL line reset + Trailing Stop ON |
| Additional order, LineReset | Reset TP/SL lines and place additional orders with current parameters. If using risk%, additional orders may not occur. This can lead to averaging; be mindful and set a maximum position limit. |
| Additional order, LineReset, TrailingStop | Reset TP/SL lines, place additional orders, and turn Trailing Stop ON |
When the TP/SL line reset is activated, the TP/SL lines are re-established based on the current price and configured parameters.
If SL line value is 10 pips and a Strategic Close is triggered on the SL line, the current price becomes the reference and the SL line moves by 10 pips.
TP line is reset similarly by the SL risk word, but reset by SL lines is limited to Break Even line.Note: If you select only line reset without partial settlement, the SL line will continue to move downward—please be aware.
Flexible Trailing Stop -FlexiTrail Stop-
TS blocks on the control panel allow turning each trailing stop ON/OFF separately for SELL TP, SELL SL, and TP-TS values, followed by BUY SL and BUY TP in four trailing stops you control individually.
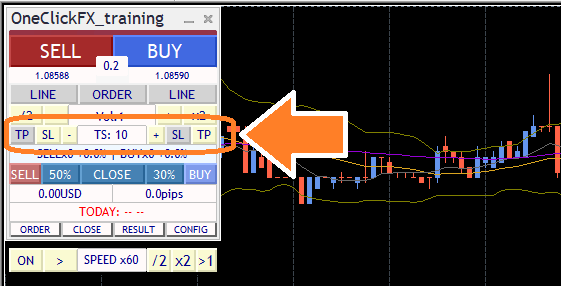
If the buttons do not respond or revert, you may be in a state where Strategic Close is setting a trailing stop. They will turn ON when TP/SL lines are hit, so until then they remain OFF.
The trailing stop line is shown in purple while you hold a position. If OFF, it appears as a dotted line; if ON, it is shown live during trading. The maximum value is detected from the previous version when you turn it ON. Turning ON/OFF recalculates from the current price maximum.
- None: NONE
Trailing Stop not used.
- Fixed: FIX
From the time it turns ON, settle when price falls below the specified value from the high. This behaves like a typical trailing stop.
- Shrink: SHRINK
Same as FIX, but on price update or each tick, compare high and move TS toward the price if no new high; if new high occurs, return to TP or SL value. If price falls after a high, trailing may lag but allows for potential rebound.
- Average: AVG
Use the average of the most recent TS values to determine trailing. The smaller the TS value, the more closely it tracks current price; larger values trail more slowly. AVG has no reset, so it tracks price movements more consistently, leading to earlier settlements if highs keep updating. It tracks even large price moves conservatively.
- Moving Average (MA)
Close positions when price touches the moving average over a specified period (e.g., MA20). It exits when the trend changes. The trailing stop period equals the MA period.
- Bollinger Bands (BB)
Exit when touching the upper or lower Bollinger Band for long/short positions. Like MA, T/S period equals the BB period; deviation 2 is fixed and cannot be changed.
- Stop-and-Reverse (SAR)
Exit when touching the specified Parabolic SAR step. SAR is an indicator by J. W. Wilder; T/S value equals 1/100 of a point. Default 10 equals 0.01. For 1 equals 0.001. Use with standard Parabolic SAR in indicators.
- Chandelier Exit
Chandelier Exit uses ATR (Average True Range) to widen stops during high volatility and tighten during quiet markets, following trends while avoiding excessive take profits or stop losses. T/S value is a factor of 0.1 and ATR period is fixed at 14.
- ProtectBE
When price exceeds Break Even line and TS+ATR value is met, push the stop line toward profitability. It follows when Break Even moves due to additional orders. Primarily to avoid losses after profits are realized, intended to raise the SL line.
This video compares the standard fixed trailing stop with Shrink L. Both follow highs, but Shrink moves the settlement line closer to the current price if new highs are not made.
Speed Control
Speed control in the lower part of the control box can be increased/decreased by values entered in the "Speed control speed list" parameter.
Clicking the "SPEED" section advances one tick; the rightmost >1 button moves to the next candle and stops at the first tick after switching.
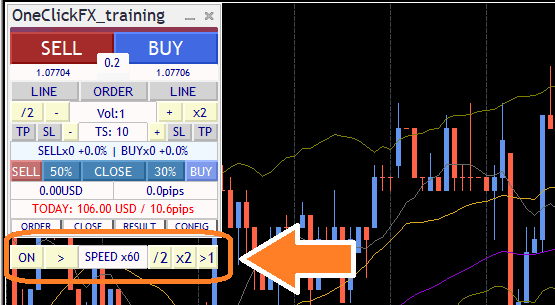
The speed specified by SPEED ranges from 1x (1 second = 1 second) to 60x (1 second = 1 minute), 3600x (1 second = 1 hour), 14400x (1 second = 1 day), and up to 604800x (7 days). However, it cannot exceed the maximum speed of the Strategy Tester. If speed control is OFF, speed is the tester’s maximum playback speed. Also, processing may slow down depending on your computer performance and indicators, so set the MT4 speed gauge to the far right (fastest) before using speed control.
High-speed skip
A feature to advance the chart quickly with one button. It moves fast until the auto-stop time or up to a year ahead. Great for accelerating practice/validation that starts at the same time every day.
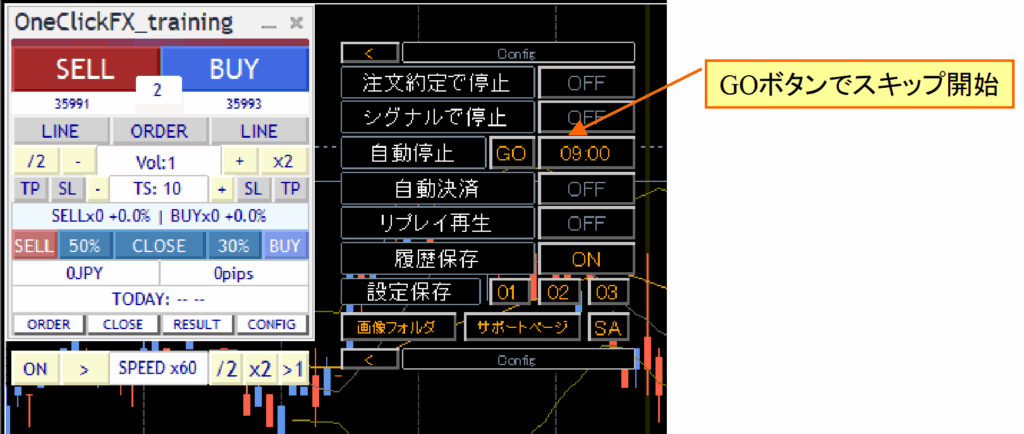
If auto-stop is ON and a time is displayed, fast-forward to that time. If auto-stop is OFF, skip ahead up to one year.
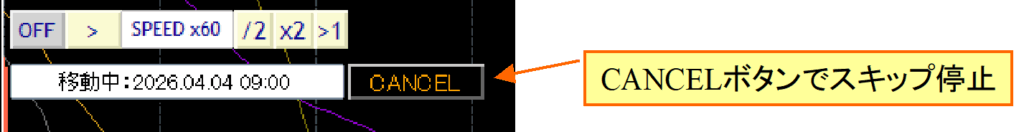
To stop fast skip, press Cancel.
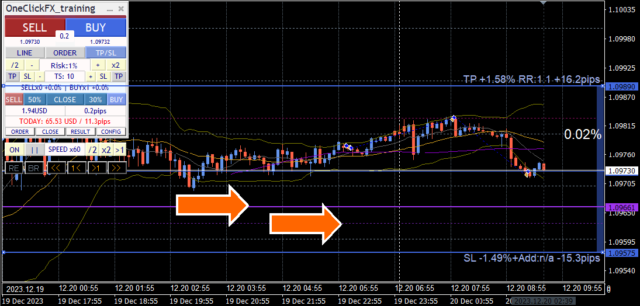
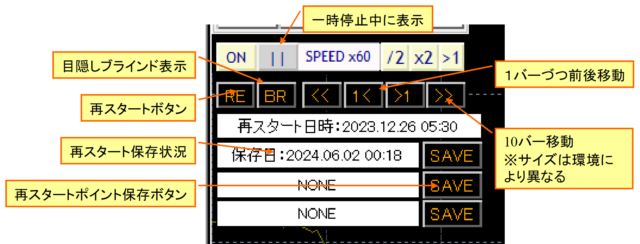
Past Verification Viewer - TheWorld -
When you pause the chart with Speed Control, additional control buttons appear below Speed Control. These are the Past Verification Viewer controls.
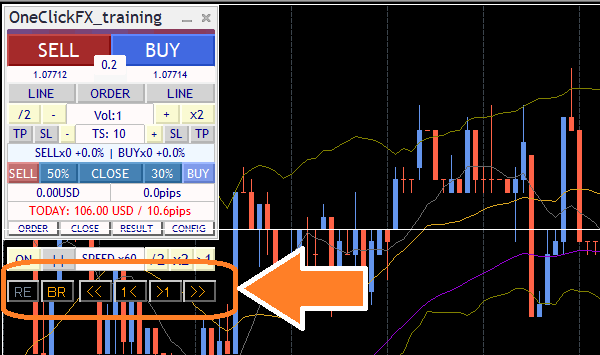
A faint synchronization line appears on the chart, and the synchronized chart lines up to the same time. You can scroll the chart left/right, and the synchronized chart will align lines accordingly.
Press "1<" or ">1" to move one candle at a time. "<<" and ">>" move about 10 candles. The number of steps depends on zoom level and environment.
Note: The simulator is paused, so you cannot move beyond the latest time. You also cannot alter trades or settlement history. If you want to modify, use the next restart function.
The "BR" button is the bridge display ON/OFF. When the bridge is displayed, future candles beyond the synchronization line are hidden.
The chart with bridge on is shown above; the one without bridge below.
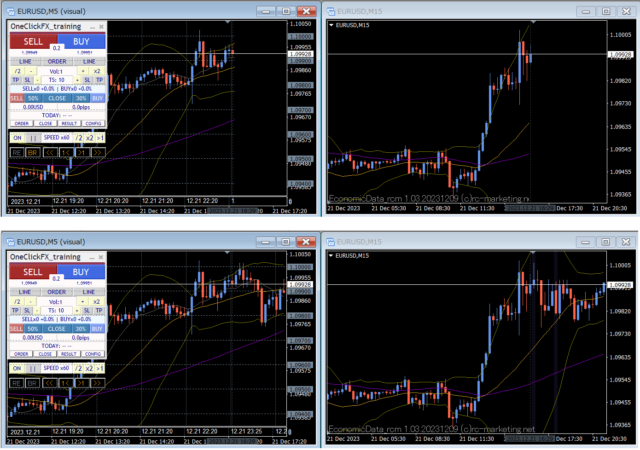
Bridging allows you to look ahead and see future data; this reveals how thinking differs when you can't see ahead.
Time Leap - Restart
If you pause the chart and press the leftmost "RE" button on the Past Verification Viewer, a panel appears. There are three save locations to preserve the current state.
After stopping and pressing Start, a restart point selection screen appears.
When you press the saved number's "GO" button, it jumps to that point with fast-forward. The "REPLAY" button resumes the same orders in normal play.
Previous data replicates the data from the last session. Not only the paused point but you can scroll the chart and move back in time; that point becomes the restart point for saving.
If you press "Replay" to save orders, the system replays with the saved order information. During replay, the sub-panel replay is ON and the speed control shows R on play/pause.
You may turn replay off during replay; turning it back ON later is fine. You can also manually settle entries made during replay. Replay participates as well.
Restart and replay generally require identical settings and time frames; they cannot be used for different times or different currency pairs.
If you are not in the same environment, it may still work, but the order contents won't change if you adjust spreads; profits and losses will change. This can be used for environmental testing under different conditions.
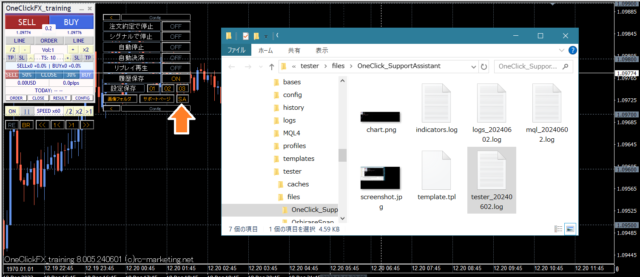
Auto Image Saving
If you set trade image saving to true, images are automatically saved on orders and settlements. Also, at the moment the date changes, a screenshot of the previous day’s trading is saved as a single image. The following images are saved.
At tester end (when you press Stop), the destination folder opens.
Save destination is data folder under tester/files/OshiraseSnap.
※ Copy all files in the tester folder included in the product package.
Saved image files are overwritten each time you start the tester, so copy elsewhere if you want to keep them.
Daily aggregates result display
Open the sub-panel to view historical trades with a yellow line and resulting PIPS displayed.
Also, clicking the date or TOTAL in the RESULT sub-panel shows the aggregated results.
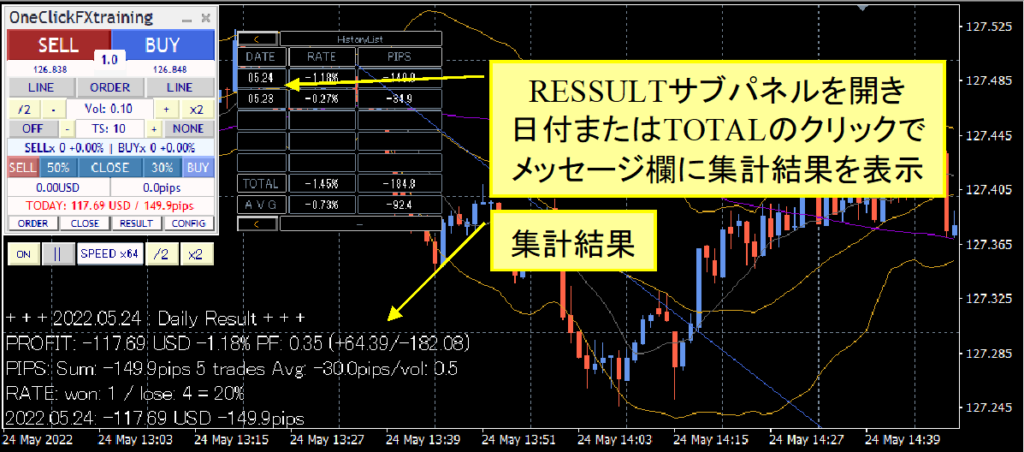
Even in the midst of the latest aggregation, you can view previous status.
Click the header to switch between daily/weekly/monthly and 10 items/100 items. RATE shows PROFIT, PIPS show PIPS/vol, PIPS/trade with respective meanings.
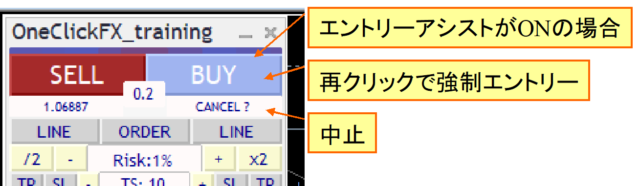
Entry Assist
Entry Assist determines guidance by detecting fluctuations from ASK, BID, and the spread to predict price moves a few seconds ahead.
Using this, after pressing the entry button, actual orders automatically pause at the optimal timing.
The strength parameter has three levels: weak, medium, strong, and disabled.
Generally, buying entries are performed as follows:
Weak: when the price move has paused (downside halted)
Medium: trend has reversed or started to rise
Strong: price is clearly rising
The Entry Assist judgment status is visible as a color bar at the top of the control panel.
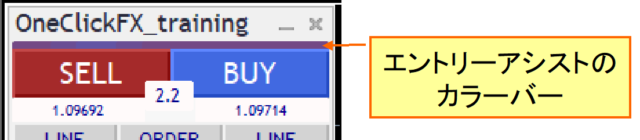
If the color bar approaches BUY color, it indicates a buy judgment; if it approaches SELL color, a sell judgment.
In the tester, spreads are fixed, so you may not see color differences; different brokers may show different judgments.
With a weak/medium/strong setting for Entry Assist, pressing the entry button will cause the button to pale and Entry Assist waits for timing. Press again to force entry; press the lower Cancel button to abort.
Although this predicts price movements a few seconds ahead, it may help deter purchases when price is strongly moving downward.
Setting strength to "Strong" may result in not entering until price rises fully, causing possible delays. Adjust to market conditions. Note the tester or fixed-spread brokers may not realize maximum effectiveness.
AI Judgment (AI Export)
Data can be exported for AI analysis. By feeding the exported trading data to an AI, you can evaluate or explore trading possibilities with AI.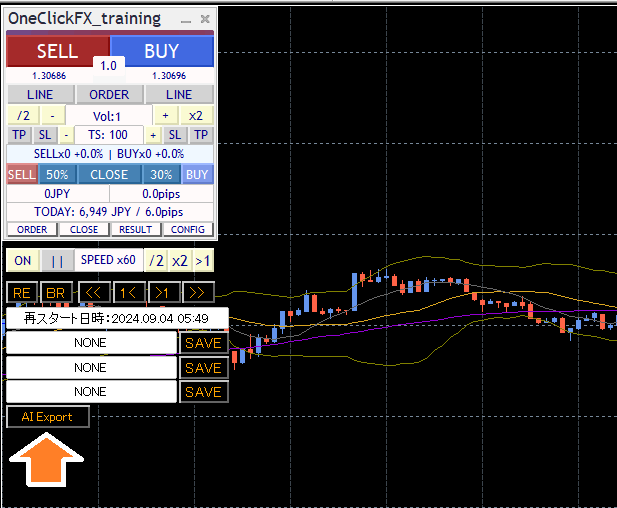
Pause chart, press RE and the "AI Export" button at bottom-right of the function panel to open a folder for AI data export. Upload this data to various AI providers to use it.
From the clip icon, please upload the file.

It will display when the upload completes successfully.

If AI data loading succeeded, try asking various questions.
For example:
“Evaluate and analyze the trade details,” “You entered on a Moving Average cross; is it correct?”, “Plot on the chart and add a 75 moving average,” “Tell me why there was a big loss and how to avoid it,” “Where would have been the correct stop placement, explain logically,” “What score would you give?”
AI responses vary from appropriate to completely off or unintended. Also consider whether the content is truly correct. Please treat as one opinion among many.
To get better answers, ask more specific questions. For example, asking “How to win in FX” yields vague, generic answers. Be specific about what you want to do. Just as you feed trading data to AI, you should provide your own information.
For reference, here are some sample data exchanges.
ai_ssample01、ai_sample02、ai_sample03
※ These samples were generated with ChatGPT Plus.
Fortunately, AI will not get upset no matter how many times you ask. If you don’t understand something, ask again. Sometimes it may be impossible, but it will usually provide some answer. You can push it with challenging questions. If you communicate correctly, it will tailor its responses. If you’re getting only generic answers, provide more specific information and request detailed responses.
※ If you are analyzing with a free AI, you can reduce data by only loading the history.csv into the AI to extend the conversation. For deeper analysis, consider the paid version.
NoteAI-based analysis requires Free AI (perplexity.ai, wrtn.jp, ChatGPT) or ChatGPT Plus ($20/month)AI Judgment is a tool for evaluating trading results and does not provide investment advice. The data and analysis results are for reference and do not guarantee any trading results or future performance. Please make your final investment decisions on your own responsibility.
Economic indicators
The included “Display economic indicators conspicuously [EconomicData_rcm]” shows economic indicators on the main and synchronized charts. Hovering over colored lines displays the economic indicators released at that time. By default, indicators related to the currency pair displayed are shown.
If economic indicator times are off, simple synchronization will generally auto-adjust, but for main and active synchronized charts you may need to manually set the server time offset. The typical default offset corresponds to summer GMT+3 / winter GMT+2.
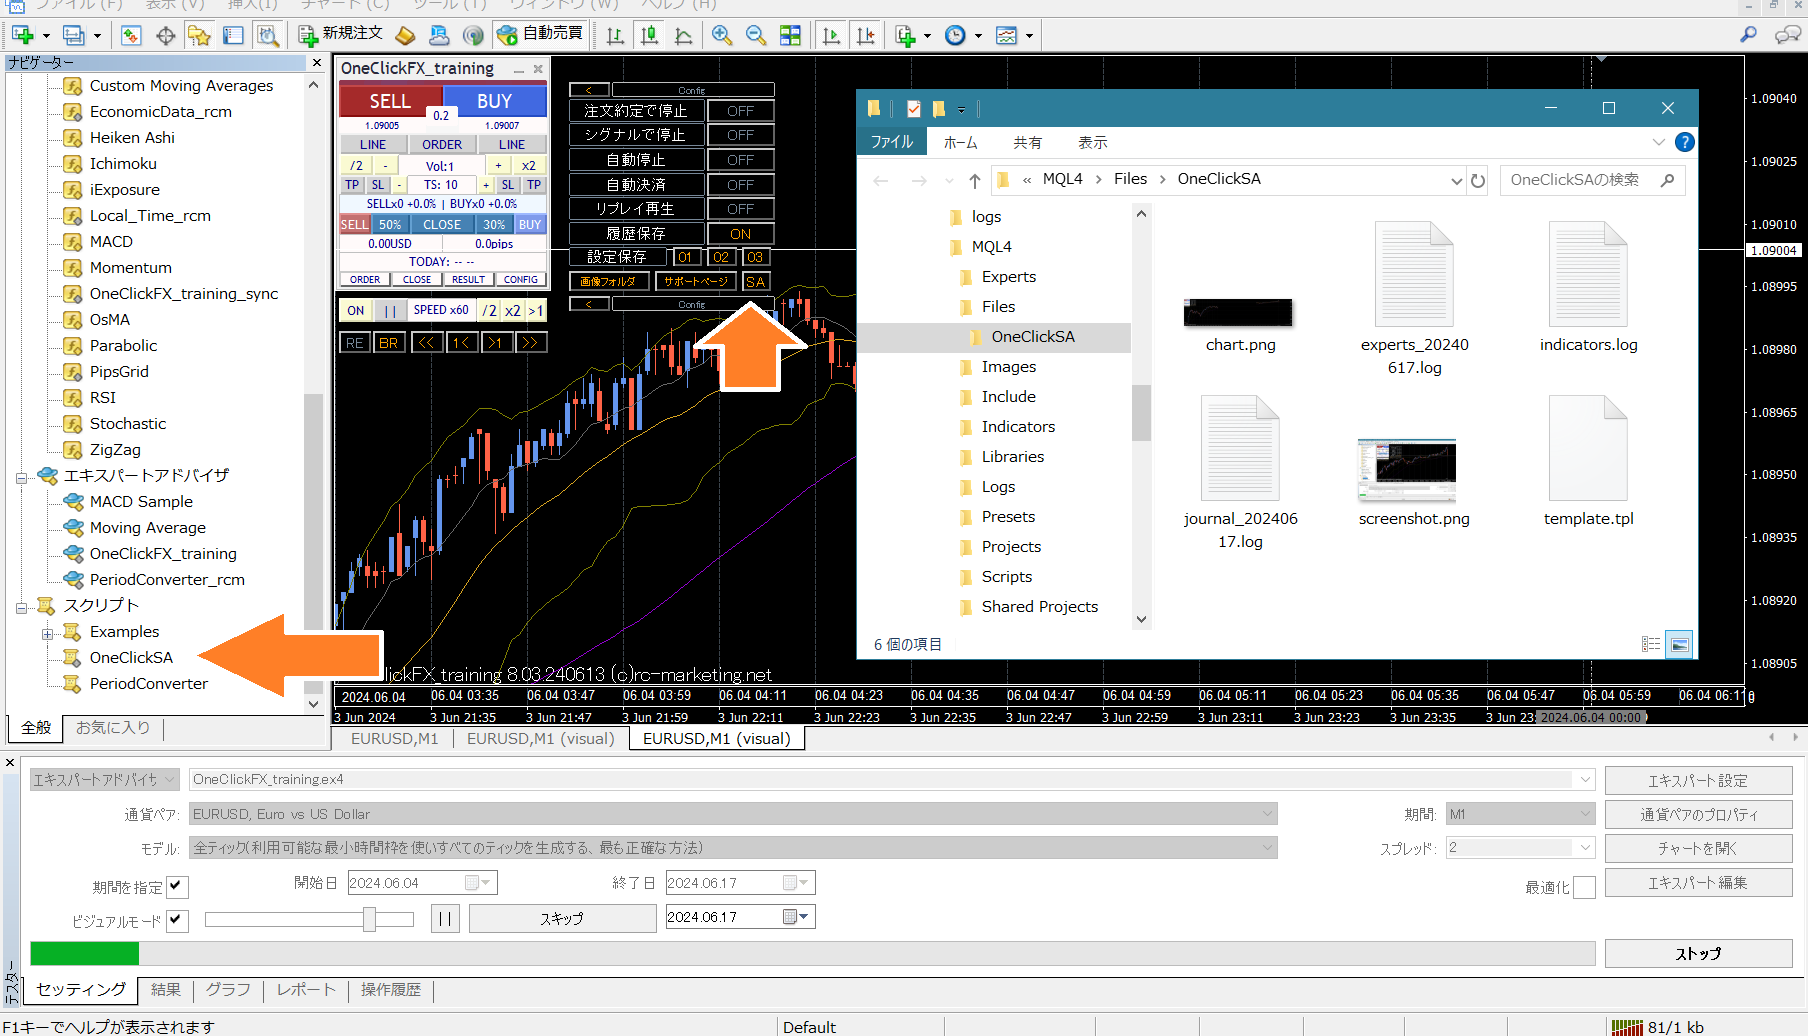
Support & Assistant
A convenient feature to collect information with one button when requesting support during trouble.
Press the SA button or double-click the OneClickSA in the Script folder to collect information, and a folder will open. Please email the generated files.
If you contact us via the inquiry form at the bottom of the page, please attach it in the auto-confirmation email after submitting the form.
■Sub-chart synchronization settings
There are two kinds of synchronization sub-charts.
1. Standard online charts for simple synchronization with lightweight switching
2. Active offline charts for near real-time display (Active Synchronization)
Simple sync uses standard online charts, so if historical data is prepared, you can specify a template chart to start synchronization easily. You can also switch timeframes and currency pairs just like online charts.
However, for shift-indicator-based charts, the chart head may be hidden, and some indicators in sub-windows may not work due to bugs. There are workarounds but with limitations.
Active sync creates dedicated offline charts and updates them regularly to resemble online charts, but some indicators may not be supported and updates can slow performance.
Both approaches have pros and cons, so choose the chart that suits you.
Simple synchronization
1) Open a chart for any currency pair
2) Right-click => Template Chart => OneClickFX_training_sync
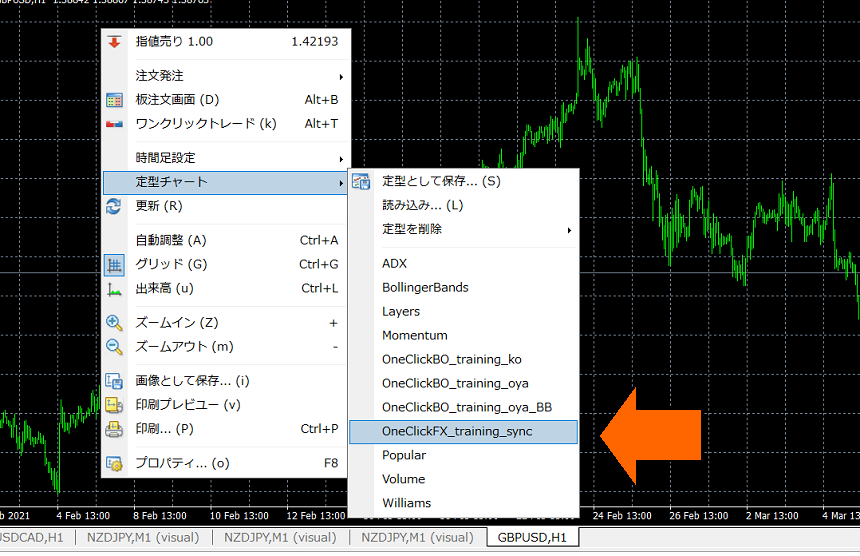
3) If needed, modify parameters and press OK
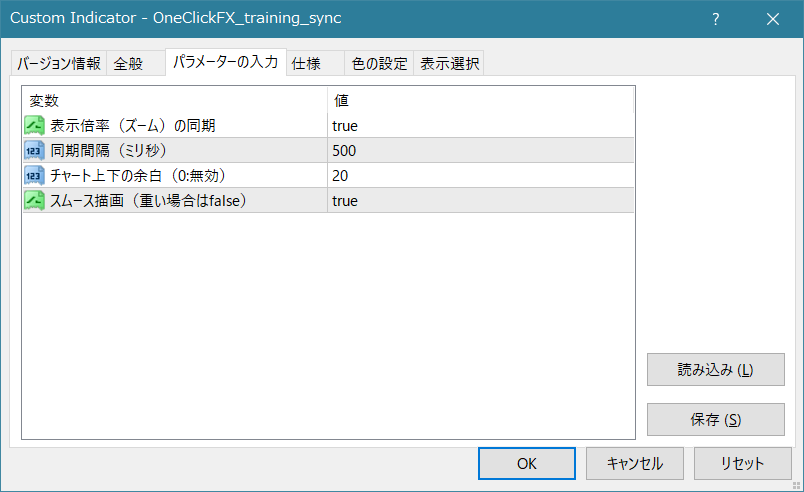
- Synchronization of display magnification (zoom): align main chart magnification with the synchronized chart.
- Synchronization period (milliseconds): set the timing for synchronization with the main chart.
- Chart top/bottom margins: automatically adjust chart height (can disable with 0).
- Smooth drawing: display TP/SL lines immediately. If performance is slow, set to false
4) Charts will synchronize
※ If speed is too fast, synchronization may be delayed
Synchronization of magnification: when you zoom the main chart, the sub-chart also zooms. If not needed, set to false.
Active synchronization
1) Open the chart for the synchronization target currency pair
2) Display the synchronization target timeframe
3) Right-click => Template Chart => select "OneClickFX_training_sync". It will show "Active offline sync ready".
If synchronizing other timeframes, change the timeframe and confirm "Active offline sync ready" for each.
※ This step is only required the first time; not needed thereafter
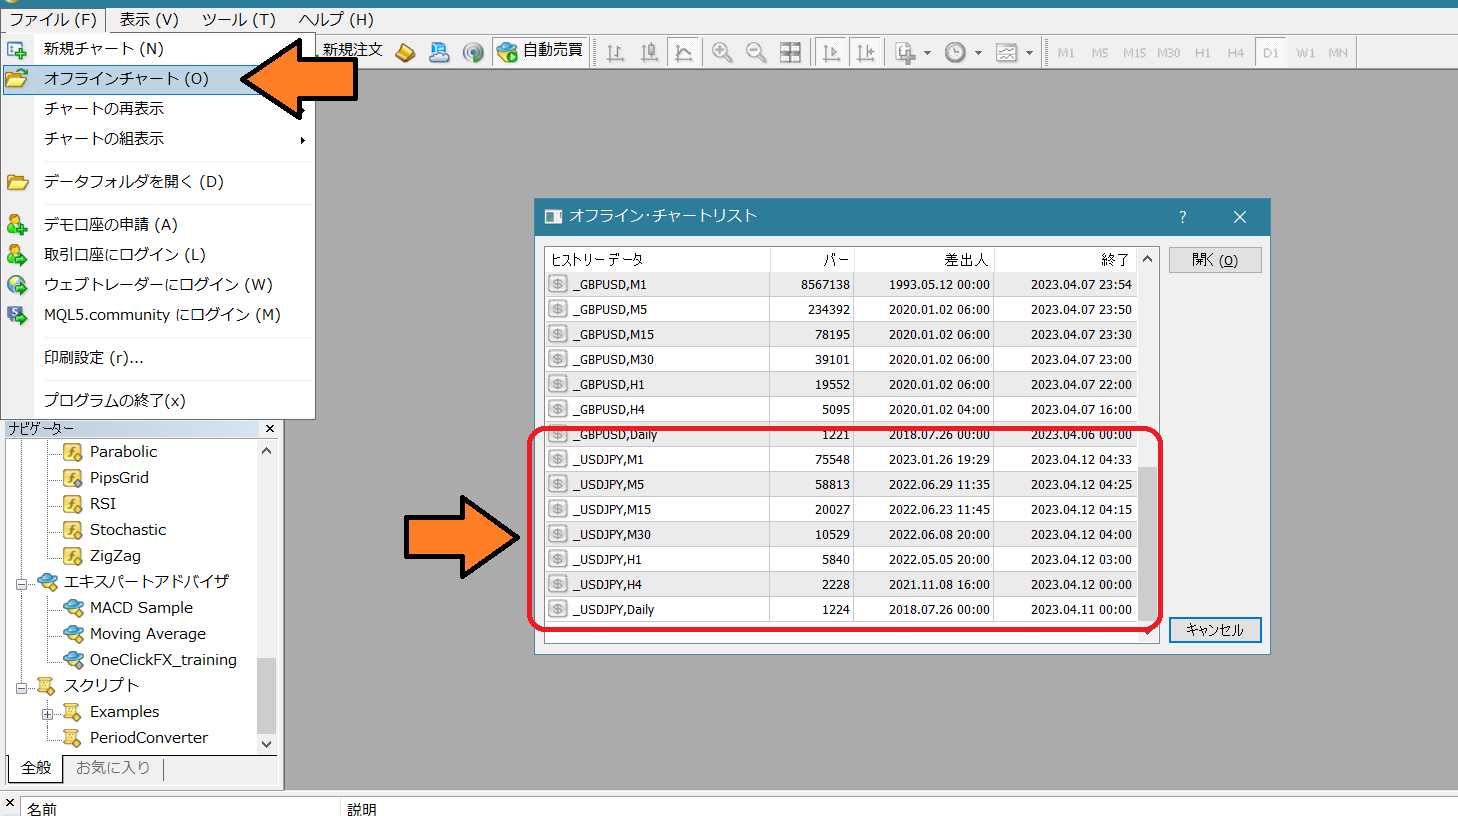
4) From the File menu => Offline Charts, open the offline chart whose name starts with "_" (underscore) (for example "_USDJPY" 1-minute to daily)
5) Right-click => Template Chart => select "OneClickFX_training_sync"
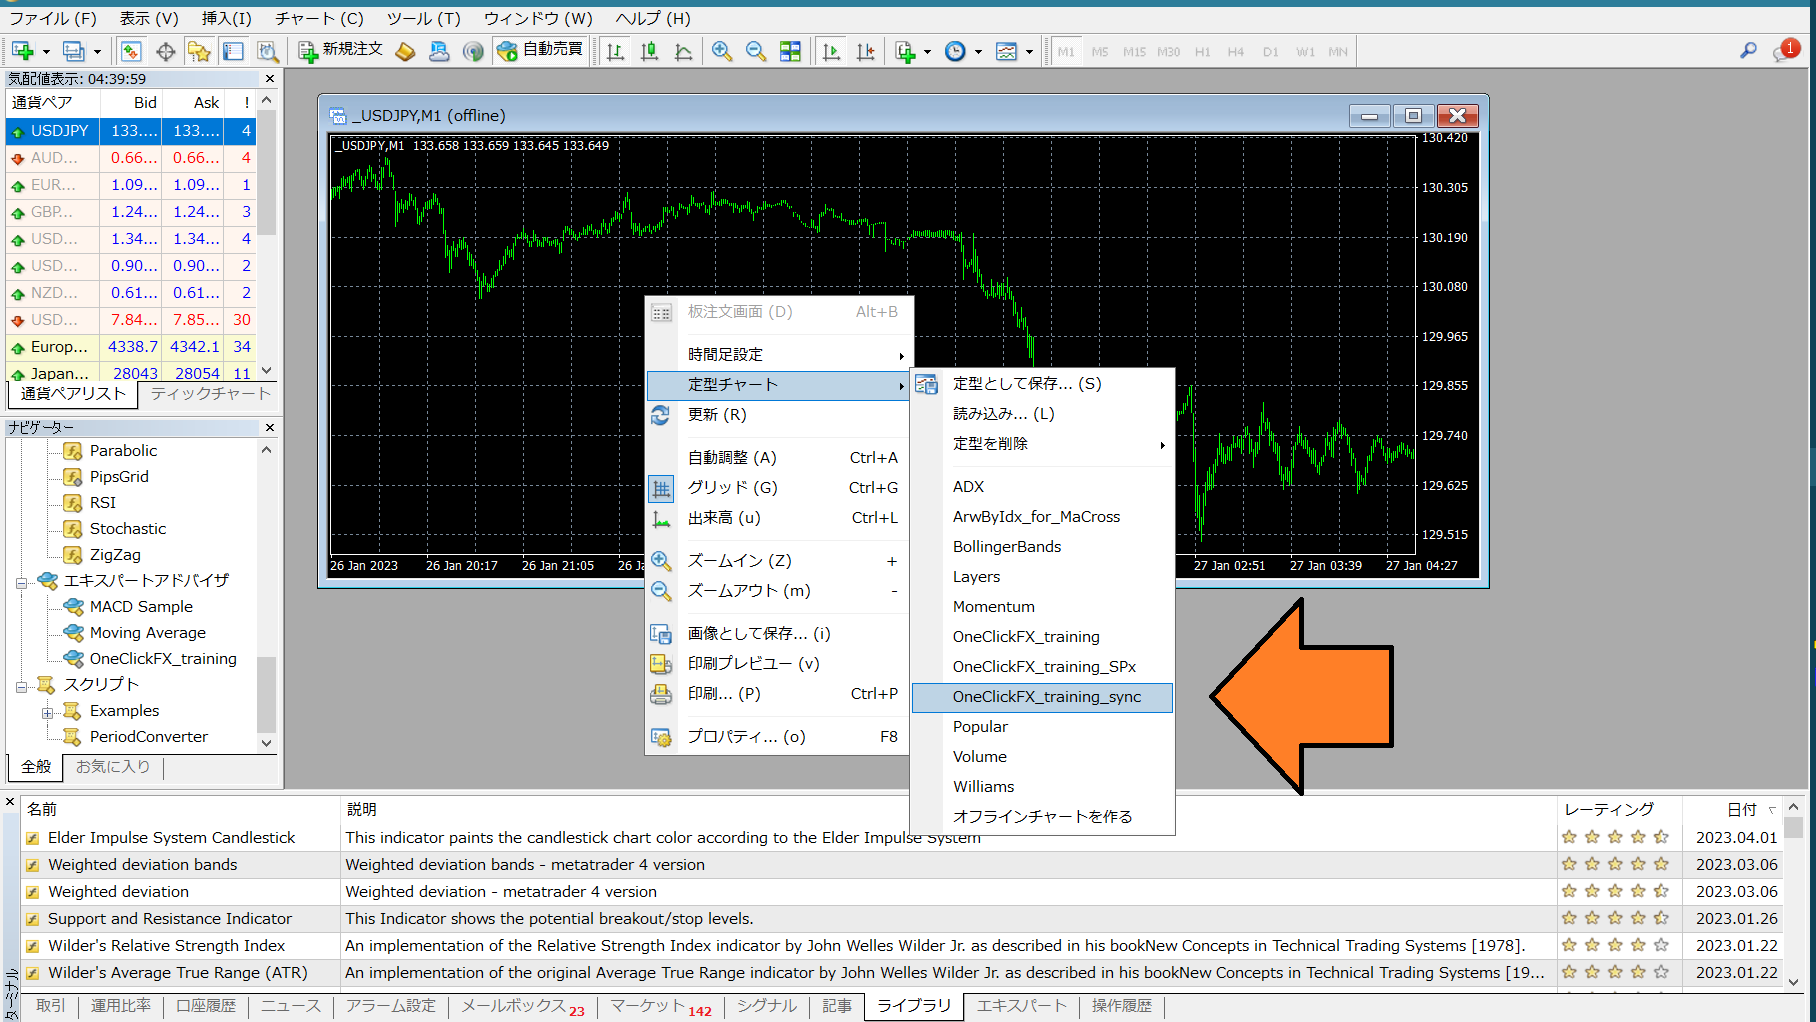
3) As with Simple Synchronization, modify parameters as needed and press OK. The charts will synchronize.
■Interfacing with Signal Tools
One-Click Auto Arrow Trade簡易 integration with signals and includedSignal Arrowization Tool (free version) allows entries to be triggered by arrows from other signal tools, enabling entries on chart changes like Golden Cross.
Integration via One-Click Auto Arrow Trade
1. Add a compatible signal tool to the chart.
2. Turn ON the signal linkage buy/sell button.
Signal linkage supports two modes: when a signal is generated and time-lagged (or according to CONFIG), you can pause or stop as per parameters. If OFF, it enters without pausing. If Pause ON, a signal will stop trading so you can analyze before continuing.
If you turn the leftmost speed-control button OFF, speed becomes the fastest (no arrows appear). If arrows do not appear, try fast-forwarding to where they would appear.If you turn the leftmost SPEED control button OFF, the speed becomes the fastest (no arrows appear). If arrows do not appear, attempt to fast-forward to where they would occur.
Integration via Signal Arrowization ToolSignal arrowization tool linkage
Also possible by using the Signal Arrowization Tool (included) in addition to the above method.Linkage with signal tools can be done by the method described above or by using the includedSignal Arrowization Tool(free version).
Signal Tool Arrowization Tool (ArwByIdx_rcm) enables entries triggered by arrows from other signal tools and entries on chart changes such as crossovers.Signal Tool Arrowization Tool (ArwByIdx_rcm) can enter with arrows from other signal tools and on chart changes like crossovers.
Included sample presets allow you to try this out, and there are sample predefined charts included as well.We have included sample presets for you to try.
ArwByIdxArwByIdx_for_MaCross.tpl – Moving Average cross_for_MaCross.tpl – Moving average cross
After starting the tester, right-click => Template Chart and select the above predefined charts.After starting the tester, right-click => Template Chart and select the above predefined charts.
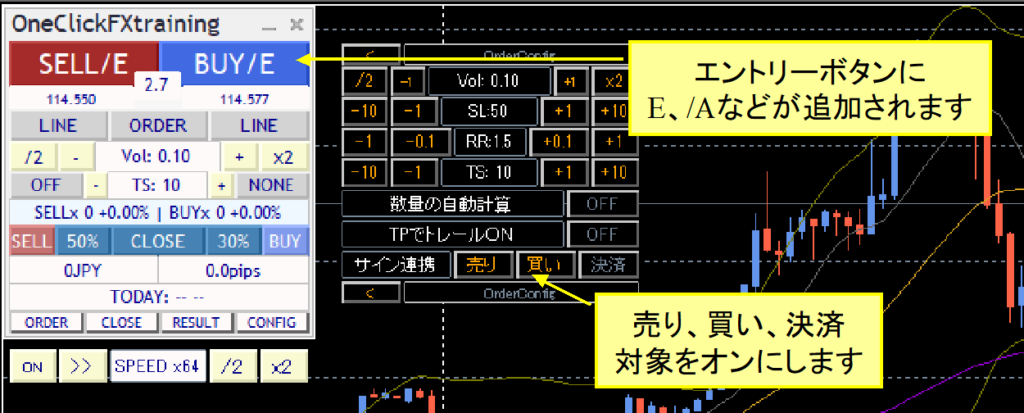
In the Orders sub-panel, enable signal linkage (sell, buy, settlement) so that buttons have /E (or /A) added.In the Orders sub-panel, enable signal linkage (sell, buy, settlement); the buttons will gain /E (or /A).
Composite conditions for signal linkageComposite condition signal linkage
The following sample predefined charts are included with the product.The following sample predefined charts are included with the product.
OneClickFX_training_SPx – composite conditions with multiple signalsOneClickFX_training_SPx – composite conditions with multiple signals
This predefined chart implements three signals: Moving Average cross, MACD cross, and Bollinger Band breakout.This predefined chart implements three signals: Moving Average cross, MACD cross, and Bollinger Band breakout.
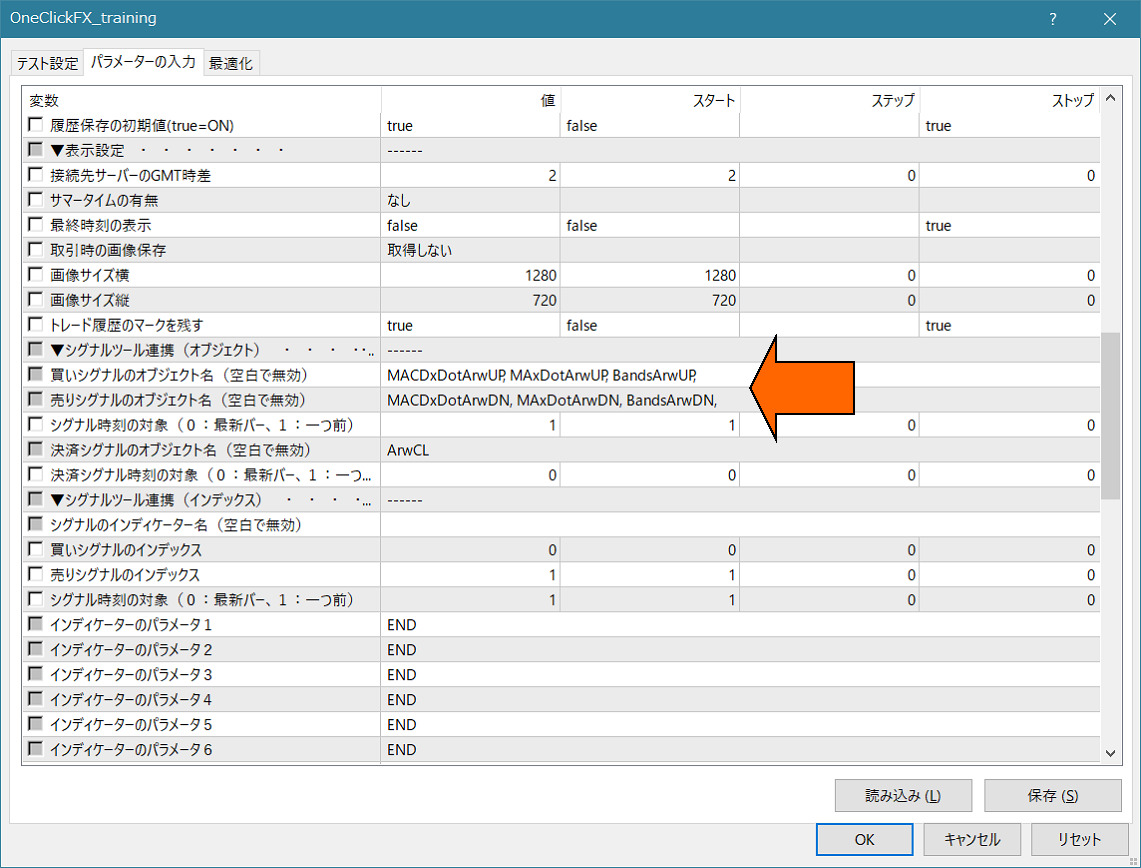
Change the parameters for signal linkage in OneClickFX_training with presets as follows.Change signal linkage parameters in OneClickFX_training as shown below.
Sell signal object names: MACDxDotArwUP, MAxDotArwUP, BandsArwUP,Sell signal object names: MACDxDotArwUP, MAxDotArwUP, BandsArwUP,
Buy signal object names: MACDxDotArwDN, MAxDotArwDN, BandsArwDN,Buy signal object names: MACDxDotArwDN, MAxDotArwDN, BandsArwDN,
In the bottom-right of the parameter setting screen, click Load to apply the preset "OneClickFX_training_SPx.set" to achieve these settings.In the parameter settings bottom-right, click Load to apply the preset "OneClickFX_training_SPx.set".
Apply these settings and operate just like simple linkage.Apply these settings and run like simple linkage.
Arrows or dots will appear at their respective caps; when all three conditions align, the signal linkage activates.Arrows or dots appear at their caps; when all three conditions align, signal linkage activates.
Change the parameters for "ArwByIdx" and register them to the predefined chart; you can change predefined charts even while the tester is running.Change the parameters of "ArwByIdx" and register that to the predefined template chart; you can modify the predefined charts even while the tester is running.
Feel free to experiment with different combinations.Feel free to experiment with different combinations.
If you don’t know how to set it up, please consult us. Most of your existing signal tools can be linked.If you don’t know how to configure, please consult us. Most of your existing signal tools can be linked reliably.
If you provide the signal tool name and parameter information, we can guide you on settings.If you inform us of the signal tool name and parameter information, we can provide configuration details.
■■Indicators included or distributed with the productIndicators included or distributed
PipsGrid Support PagePipsGrid Support Page■■Troubleshooting & TipsTroubleshooting & Tips
https://www.gogojungle.co.jp/finance/navi/articles/45682">https://www.gogojungle.co.jp/finance/navi/articles/45682">https://www.gogojungle.co.jp/finance/navi/articles/45682https://www.gogojungle.co.jp/finance/navi/articles/45682
・Preparing historical data・Prepare historical data
【2024版】MT4のPast Data Setup Without Failure【2024版】MT4のPast Data Setup Without Failure
・Want to use old colors from V6, etc.・Want to use old colors from V6 etc.
Change the parameter “Buy color” to Green to use those colors.Set the parameter "Buy color" to Green to use those colors.
・Profit and loss with commission-bearing accounts・Profit and loss with commission-bearing accounts
If an account incurs commissions, profit/loss is shown including commissions, while PIPS are shown excluding commissions.If commissions are charged, profit/loss includes commission; PIPS are shown without commission.
Note that commissions vary by broker, so not all scenarios can be guaranteed.Note that commissions can vary widely, so not all cases can be guaranteed.
NotesNotes
■■If you are in troubleWhen in trouble
If something is not functioning properly or behaving oddly or stops abruptly, first check this area.If something is not functioning properly or behaves oddly or stops, first check here.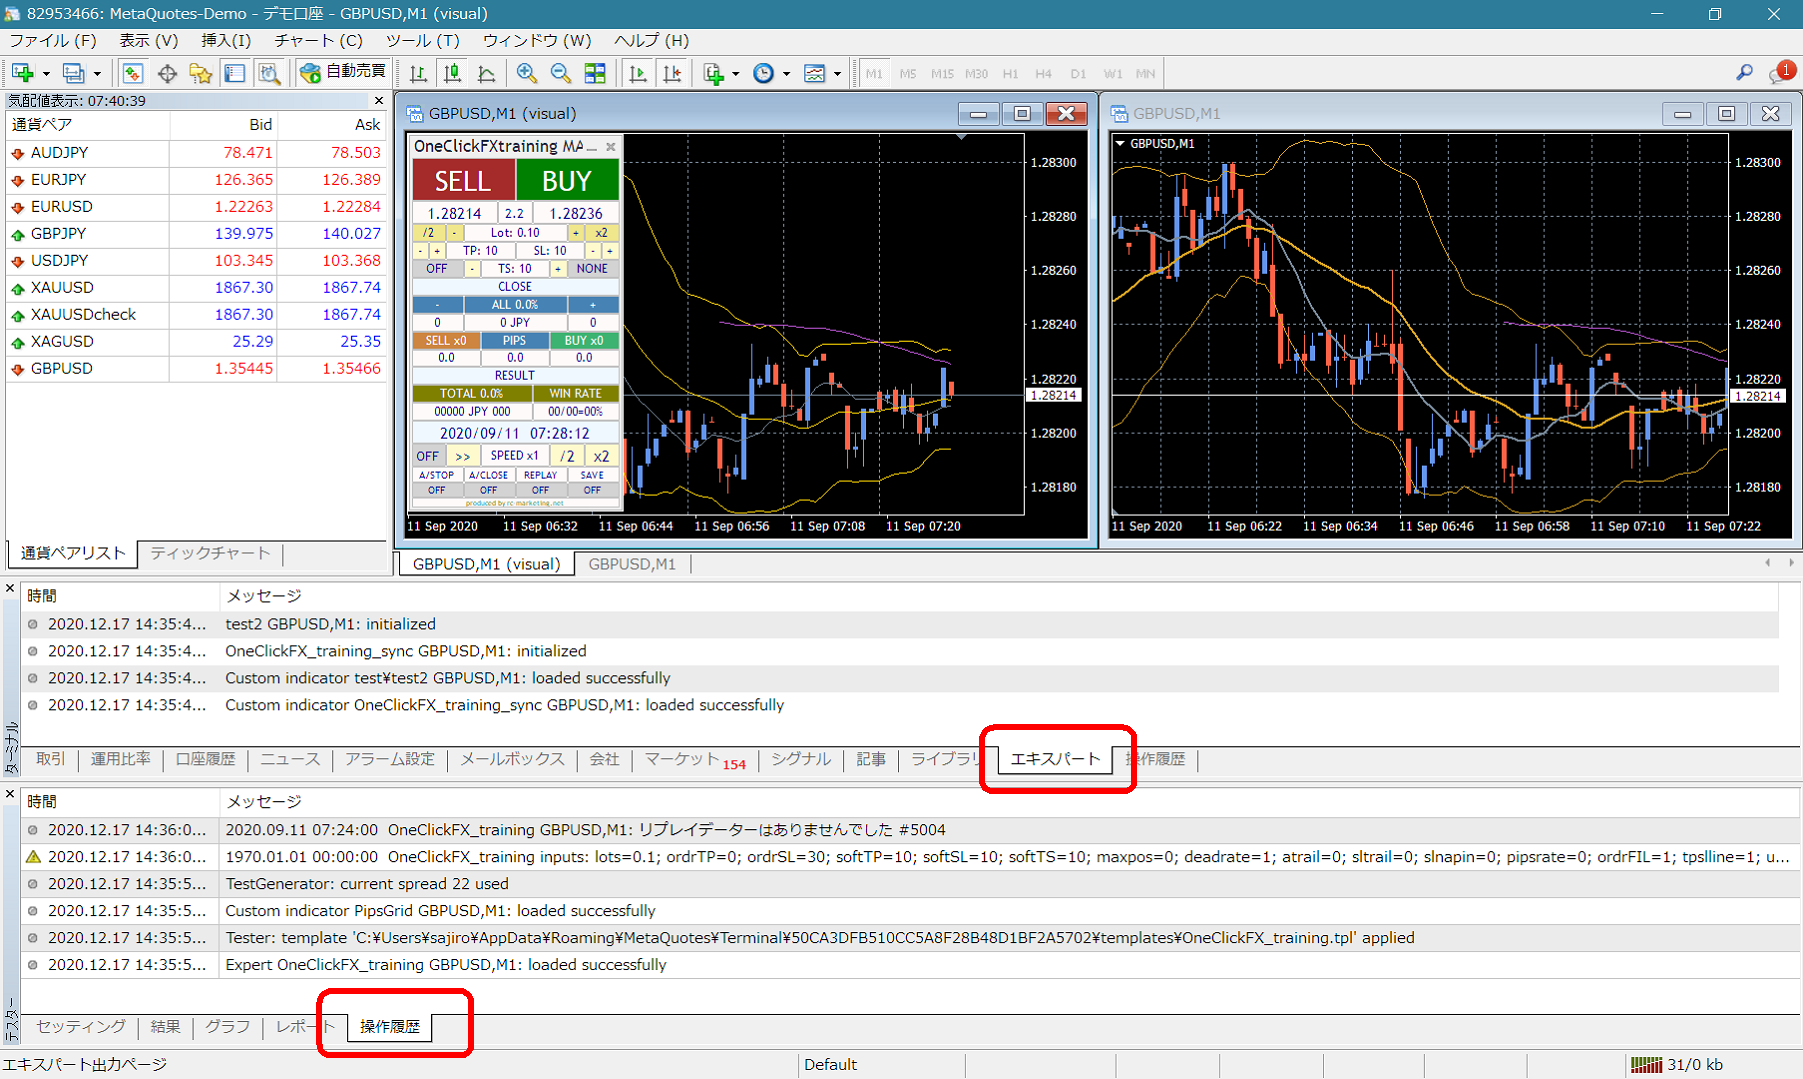 If there are error messages in the terminal expert or tester operation history, please inform us; it makes support smoother. We appreciate your cooperation.If error messages appear in the terminal expert or tester history, please inform us; it will help resolve faster. Thank you for your cooperation.
Support AssistantSupport Assistant
Some products include a convenient feature that collects information with one button during trouble: press the "SA" button to collect information and open a folder. You can also double-click the Script folder's OneClickSA.Some products include a handy feature that collects information with one button during trouble. Press the "SA" button to collect information and open a folder. Also, double-click the Script folder's OneClickSA to do the same.
 Please attach and email the generated files.Please attach and email the generated files.