
[US Stocks] After a short decline that cannot be called a correction, quickly sets a new high.
Hello,I'm Lehman (@Lehman1980).) is.
In the previous article, I said there would be adjustments,
but starting from the beginning of the week, I recovered the dip as if nothing happened.
The Fear & Greed Index also remains in the 60s as of February 13.
And the S&P 500 index has, since February 4, repeatedly reached all-time highs..
<S&P500 index closing price / all-time high 3934 (20210213)>
March 23: 2237 (COVID-19 crash bottom)
May 15: 2863
October 23: 3465
December 31: 3756
February 12: 3934
https://jp.investing.com/indices/us-spx-500-historical-data

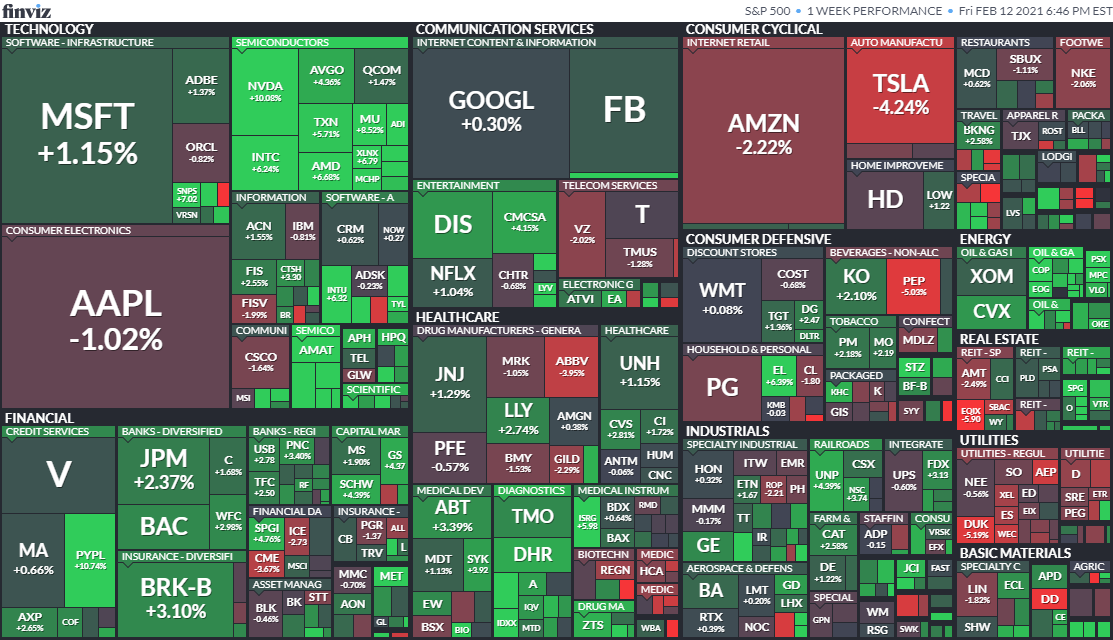
Second week of February heatmap(Source: finviz.com)
GAFAM are little changed. TSLA has fallen sharply. Energy is strong due to rising crude oil prices.
Semiconductors like NVDA, INTC, and AMD continue to rise.
U.S. stock holdings
This is an account summary from SBI Securities. (as of February 12 close)
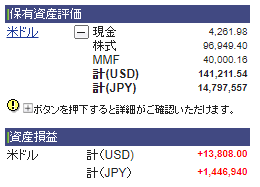
Unrealized gains have reached $13,800.
Compared with the maximum loss during the COVID-19 crash around March last year,
this means I have recouped over $20,000 in a year.
Unlike the Lehman Shock, I did not expect the stock prices to recover this much in a year, but I am satisfied as a result of staying in the market and adding funds.
Cumulative realized losses and dividends show about a $9,300 profit. Compared to the previous article, about an additional $4,300. Of this, $107 is after-tax dividends from T, GIS, and PFF deposited in early February.
Cautious about a corrective phase, since January I have been participating in the market conservatively, mainly increasing purchases of VT, and am enjoying the uptrend.
With stock holdings around $97,000 and cash reserves in money market funds around $44,000, the ratio is 68:32. Since I have nearly met the near-term goal of 70:30, I would consider selling a portion if prices rise further.
Alternatively, if the yen strengthens to below 103 yen per dollar, I will do additional dollar conversions to adjust liquidity.
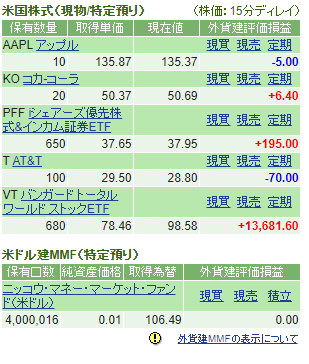
Buy: VT (640→680) AAPL (10) KO (20)
Sell: GIS (50→0)
I exited GIS at $58.
It rose to $60 in January, but then drifted lower afterward.
It looks like a downward-trending boxy chart.
Instead, I purchased AAPL and KO from the continuation-check list.
I missed timing on NVDA and PYPL.
I aim to target them at the next adjustment.
<Continuation-check stocks>
Large caps: AAPL, MSFT, TSLA
Semiconductors: QCOM, NVDA, INTC, AMD
Financials: PYPL, BLK
Consumer staples: PG, KO, PEP, PM, BTI
Communication: T, DIS, CMCSA, ZM