

Review of yesterday's US employment data with video!
Hello!
This is Satori, researching Binary FX.
Today I will look back on the moves after yesterday's U.S. employment statistics release.
The figure below shows the USD/JPY 5-minute chart movement around 22:30 on February 5, 2021.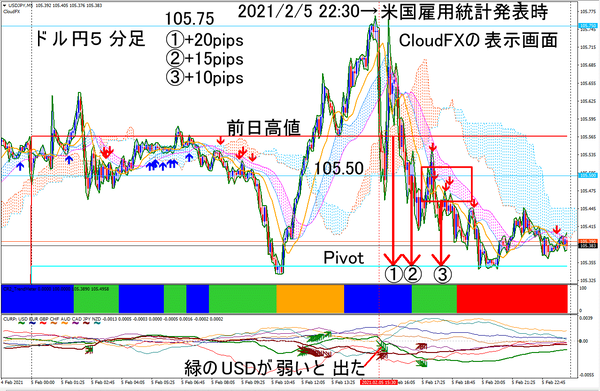
https://livedoor.blogimg.jp/fxmt4indicator/imgs/3/0/30990c19-s.png
In the above figure, CloudFX is displayed.
1) The profit when selling at the resistance-turning point of the previous day’s high and closing the position with Pivot.
2) The profit when selling at the resistance-turning point of 105.50 and closing the position with Pivot.
3) The profit when the volatility settled and a signal appeared at the Heikin-Ashi Cloud touch, selling and closing with Pivot.
Yesterday, after a sharp drop, the price fluctuated a lot, so entries could only be made in the latter half beyond ②.
Of course, those who can take risk or, with binary options, those who could sell at the peak 105.750 or buy a Low option might have profited nicely.
If you could sell at 105.750 and close at the previous day’s high, it would have been +18 pips.
Accumulating such reflections should lead to results.
The indicators used today are as follows.
Scalping Indicator CloudFX
https://www.gogojungle.co.jp/tools/indicators/27332
A YouTube video also looks back on it.
https://youtu.be/274qMKYLTD0
Thank you very much for reading up to here today.
Email: info.atmarkcanary2.net
※Register for the "FX Wave Riding" Free Newsletter
https://1lejend.com/stepmail/kd.php?no=UbHSvri


