Combining the “Multi-Time Half-Price Chart” with the “Cloud Alert + Higher-Timeframe Bollinger Bands” trade system enables trades with an edge
The “Multi-Timeframe Half-Value Chart” is not something devised to trade by itself. It is intended to be used as an auxiliary chart for day trading and scalping.
In practice, the combination of theMulti-Timeframe Half-Value Chart and“Cloud Alert + Higher Timeframe Bollinger Bands” trading systemallows for trades with greater edge.
Specifically, you grasp the overall market view below the daily chart with theMulti-Timeframe Half-Value Chart, while using the“Cloud Alert + Higher Timeframe Bollinger Bands” trading systemto identify actual trade points.
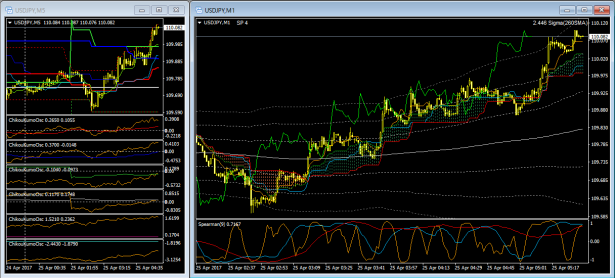
For example, when scalping, the five-minuteMulti-Timeframe Half-Value Chartis displayed alongside the one-minute“Cloud Alert + Higher Timeframe Bollinger Bands” trading system.
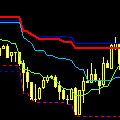
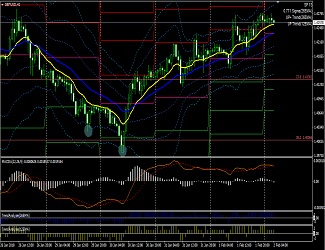
The left side is theMulti-Timeframe Half-Value Chart for the 5-minute chart, and the right side is“Cloud Alert + Higher Timeframe Bollinger Bands” trading systemfor the 1-minute chart.
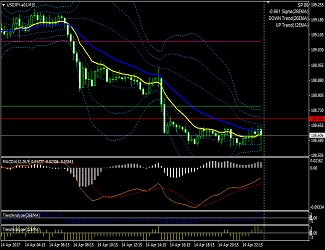
“Cloud Alert + Higher Timeframe Bollinger Bands” trading systemis a system that allows for decisive trades by watching the larger trend via the higher-timeframe Bollinger Bands, cloud turns, and Span 2 touches, but since it only focuses on the next higher time frame (e.g., for a 1-minute chart, the 5-minute chart), you may miss certain larger market turning points.
Therefore, by using theMulti-Timeframe Half-Value Chartin conjunction, you can also grasp the market movement of two or three higher time frames in real time.
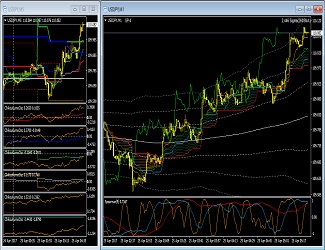
For day trading, you can set the“Cloud Alert + Higher Timeframe Bollinger Bands” trading systemto the 5-minute or 15-minute chart, and monitor the 1-hour, 4-hour, and daily charts simultaneously with theMulti-Timeframe Half-Value Chartto select trading points.
Trading, in itself, is ultimately a localized battle, but because you understand how the overall market is moving and where your position lies, you can conduct position management with confidence.