

Enhancing EA performance using Excel data analysis - Session 2 (Correlation analysis)
第2回(相関分析)
1.フィルタ選定の難しさ
When backtesting the created EA, there are trades that yield profit and trades that yield a loss.
Therefore, everyone hopes to keep as many profitable trades as possible and
to exclude as many losing trades as possible with filters.
However, it is very difficult to determine which filters to use.
At first I tried adding various indicators to the chart, but I couldn’t find good
filters. So I decided to perform statistical processing using EXCEL.
2.EXCELへデータ移行
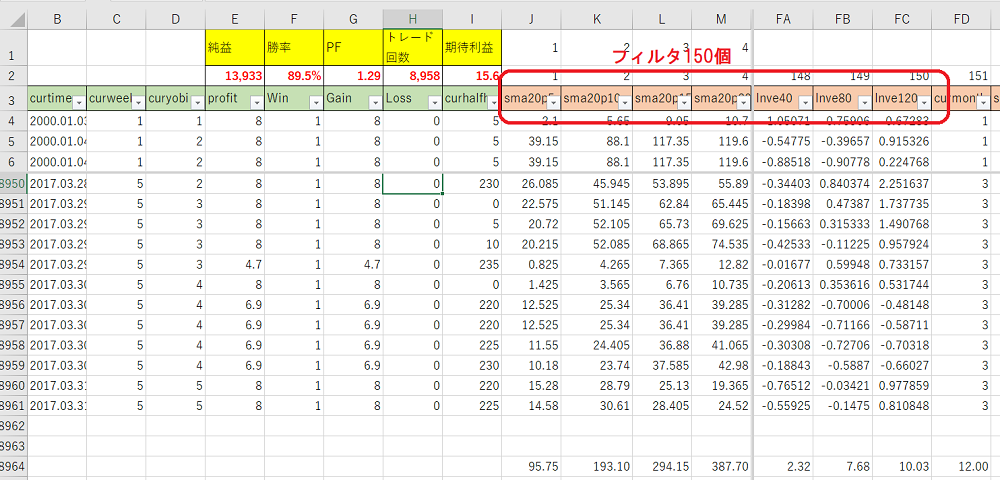
When data obtained from MT4 is migrated to EXCEL and organized, it becomes a table like the one below.
If you change the values of the 150 filters in this table from J3 to FC3, the 12-year trade results will change.
3.相関分析
Among the 150, an analysis of correlation was conducted to find effective filters.
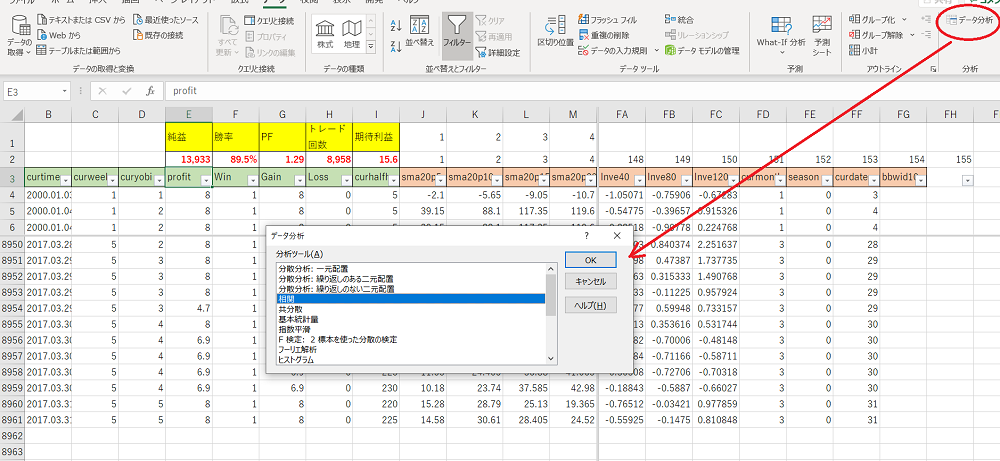
First, in Excel, choose Data → Data Analysis and select Correlation.
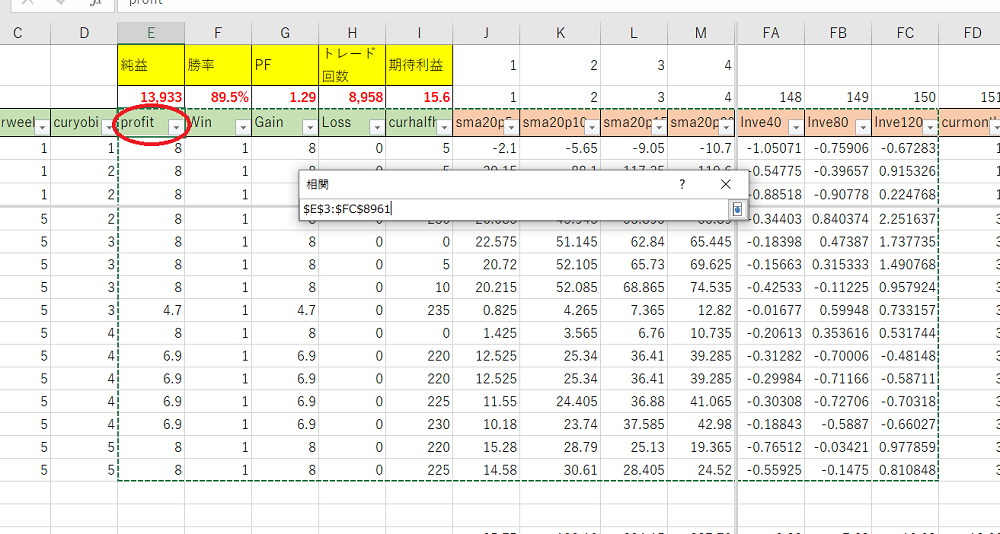
Specify the range for correlation analysis.
4.相関分析をした結果
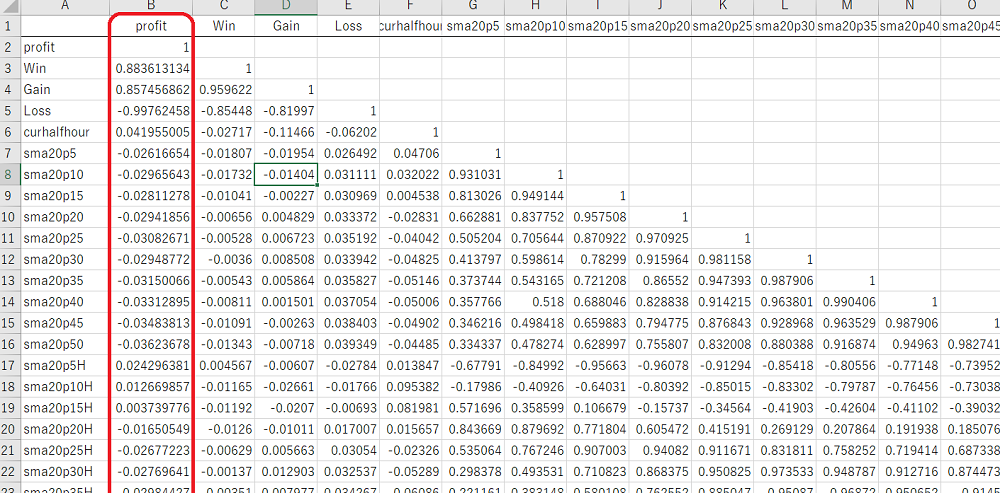
From these, only the columns correlated with profit, and sorted by the absolute value of the correlation coefficient, are shown in the figure below.
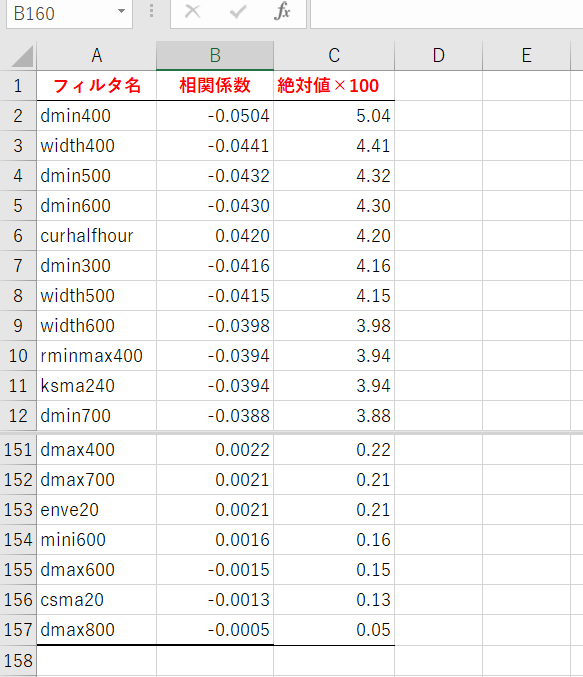
A negative correlation coefficient indicates that increases/decreases in the value go in the opposite direction to profit.
After trying about 2,000 various filters, I currently select 150 filters that seem optimal.
All of my constructed EAs use this method, and since its commercial release, they have been steadily profitable.
■ EA 販売サイト
“Senji Ban Aka” https://www.gogojungle.co.jp/systemtrade/fx/14944
“Sanji Suimei” https://www.gogojungle.co.jp/systemtrade/fx/15576
“Kaka Kurenyan” https://www.gogojungle.co.jp/systemtrade/fx/17258
“Fuurin Kasan” https://www.gogojungle.co.jp/systemtrade/fx/21039
■ 本手法を使ってEAをブラシアップするツールの販売サイト
“Tool for Increasing EA Profit via Excel VBA”
www.gogojungle.co.jp/tools/indicators/6351
以上。