
【GOLD AI Forecast】 November 16–20 | $3852 is the turning point! Will it rebound from the second bottom, or continue to fall to $3734
?This article was posted on November 15, 2026=>Latest related articles?
This article introduces the results of visualizing market analysis by MT5 AI Assistant throughAI Analysis Visualizer. It is an AI forecast based on chart data at a specific point in time and does not guarantee future prices or profits.
Analysis target: GOLD
Analysis timeframe: H1・D1
Analysis period: November 16, 2026 to November 20, 2026
Date of analysis: November 15, 2026
Previous weekly close: $3882.55

① Current market situation: Gold once again moves with a dollar-led trend
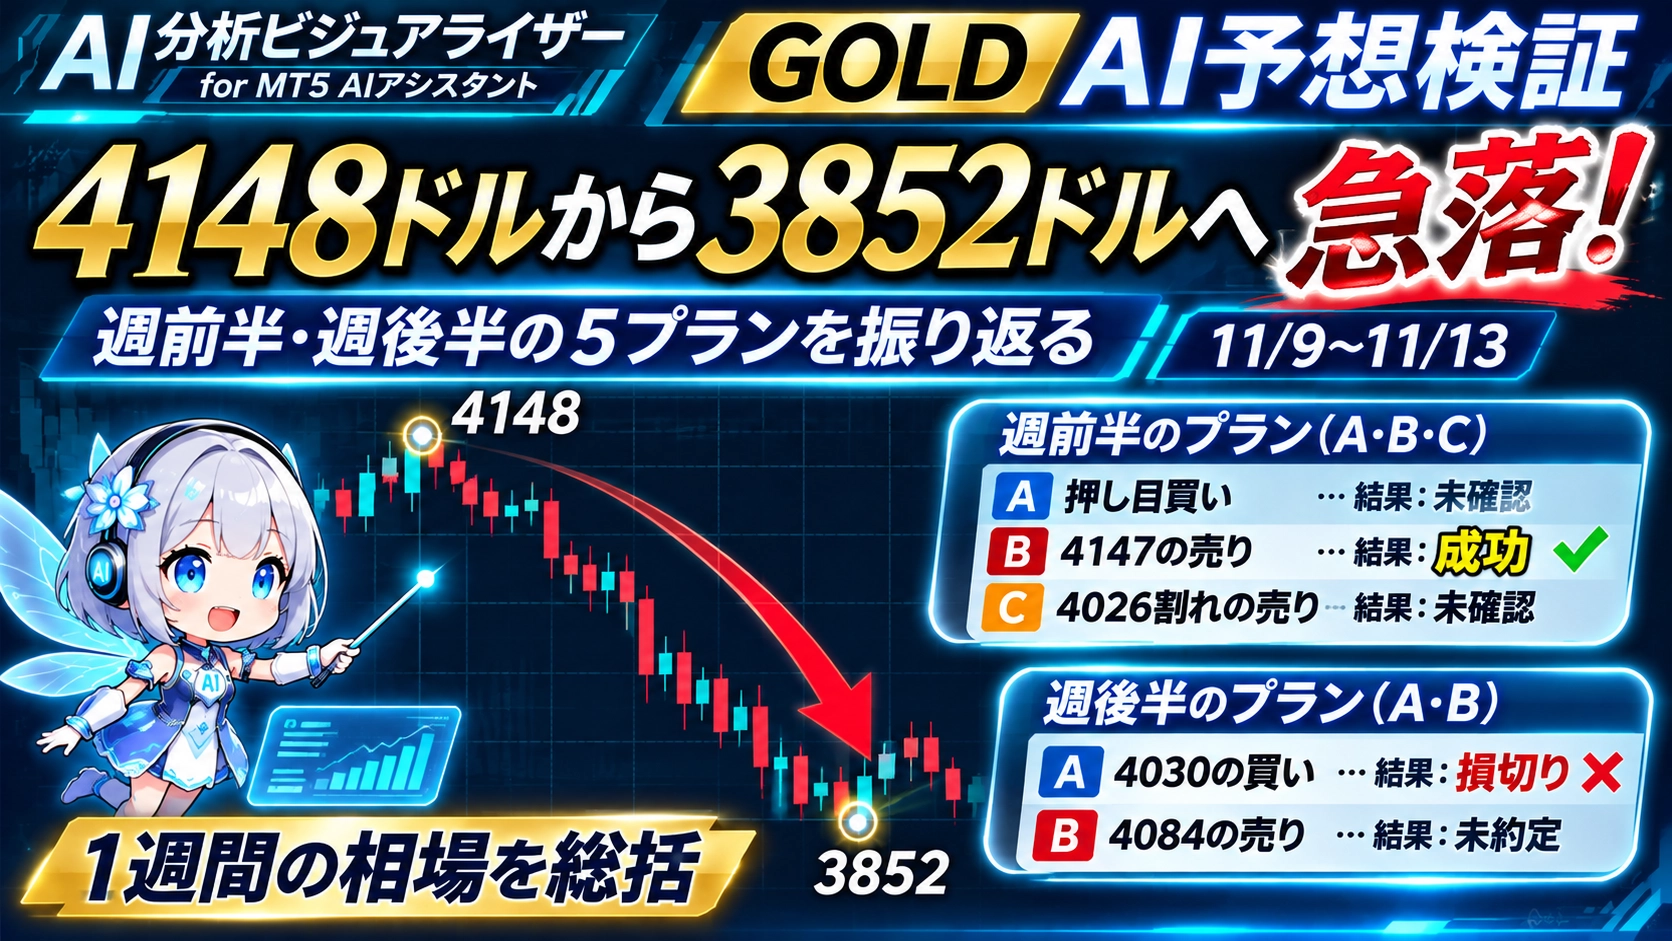
Gold fell from $4,065.11 at the start of the week to $3,882.55 at the end.
It rose to $4,148.25 on November 9, but then sharply reversed. On November 12, it dropped to $3,852.22, nearly erasing the gains from the election week.
What drew attention in this drop was the movement of the dollar.
USDJPY rose from the 157-yen range to the 160-yen range. Dollar strength accelerated the decline in gold prices.
Last weekend, GOLD was $3,882.55. It is close to the October 30 low of $3,869.95, and sits near the bottom of the recent range (3852–4148 dollars).
Meanwhile, the daily MA10 is $4,001.7, MA20 is $4,024.1. The current price is about 119 points below MA10, indicating a short-term oversold condition.
The H1 Bollinger Bands have converged to a width of about 53 points, from $3,864.4 to $3,917.6.
After the steep decline, price action has calmed, and attention turns to which direction it will breakout next.
② Notable technical points
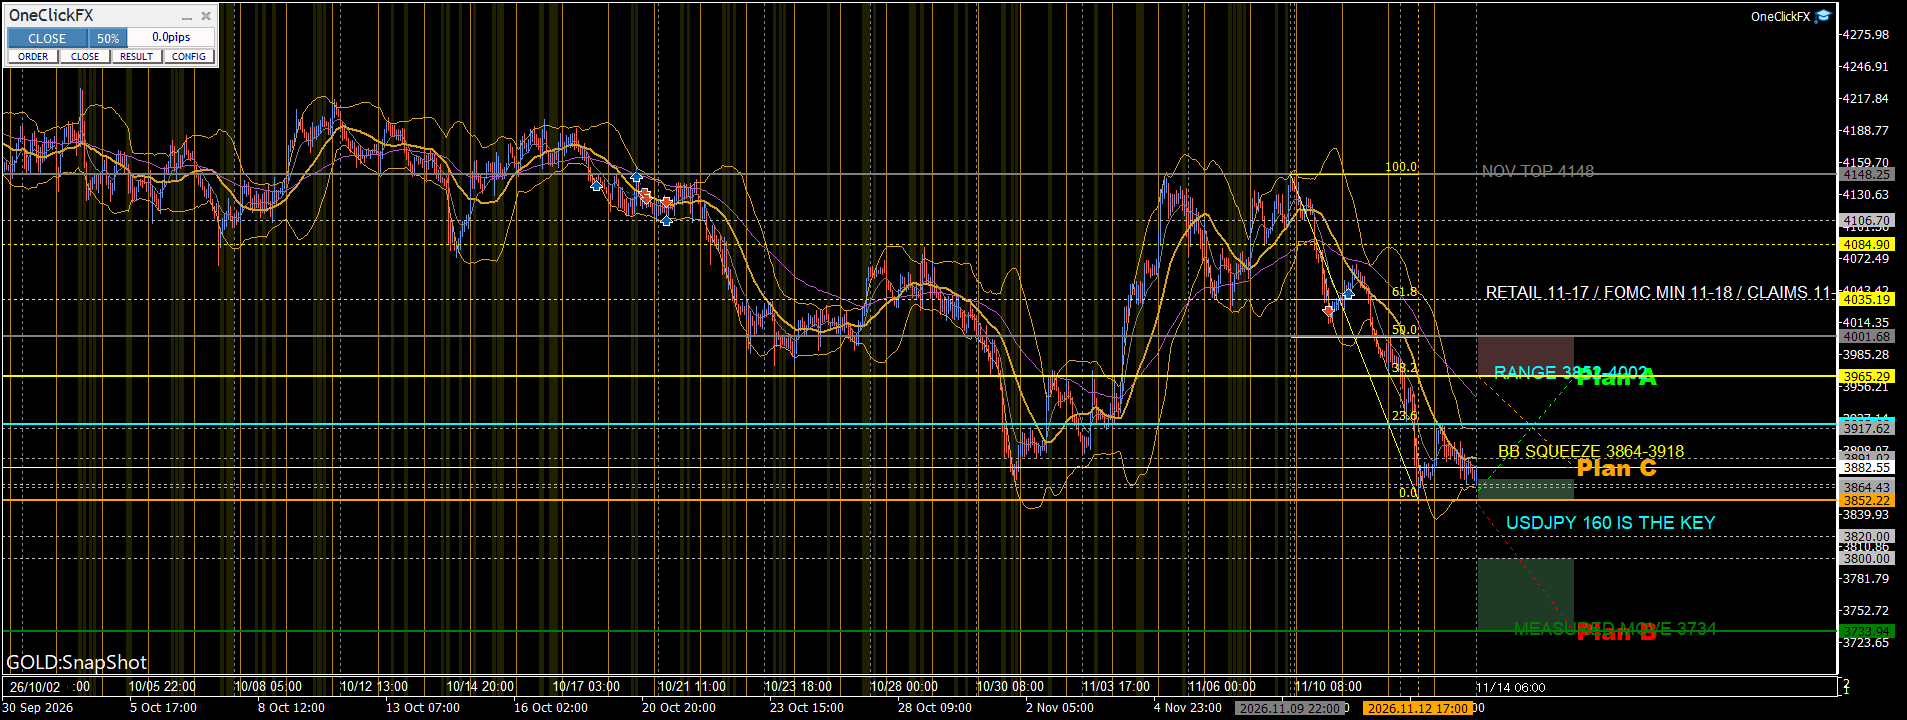
Price levels that will be important in this analysis.
Support / downside targets
- $3,867.40: low of last Friday
- $3,852.22: low of last Thursday
- $3,820: next downside target
- $3,800: round number
- $3,733.94: measured target derived from October range
In particular, $3,852–$3,867 is close to the October 30 low of $3,869.95 and is a key zone that could form a second bottom.
Return target / resistance band
- $3,922.08: Fibonacci 23.6%
- $3,965.29: Fibonacci 38.2%
- $4,000.24: Fibonacci 50%
- $4,035.19: Fibonacci 61.8%
Near $4,000 aligns with the daily MA10 of $4,001.7. The coincidence of Fibonacci 50% and the moving average makes it a strong upside resistance level.
Bollinger Bands (H1)
- Upper: $3,917.6
- Middle: $3,891.0
- Lower: $3,864.4
The convergence of Bollinger Bands is a key point to watch for future price movement.
③ AI forecast for next week and trading plan
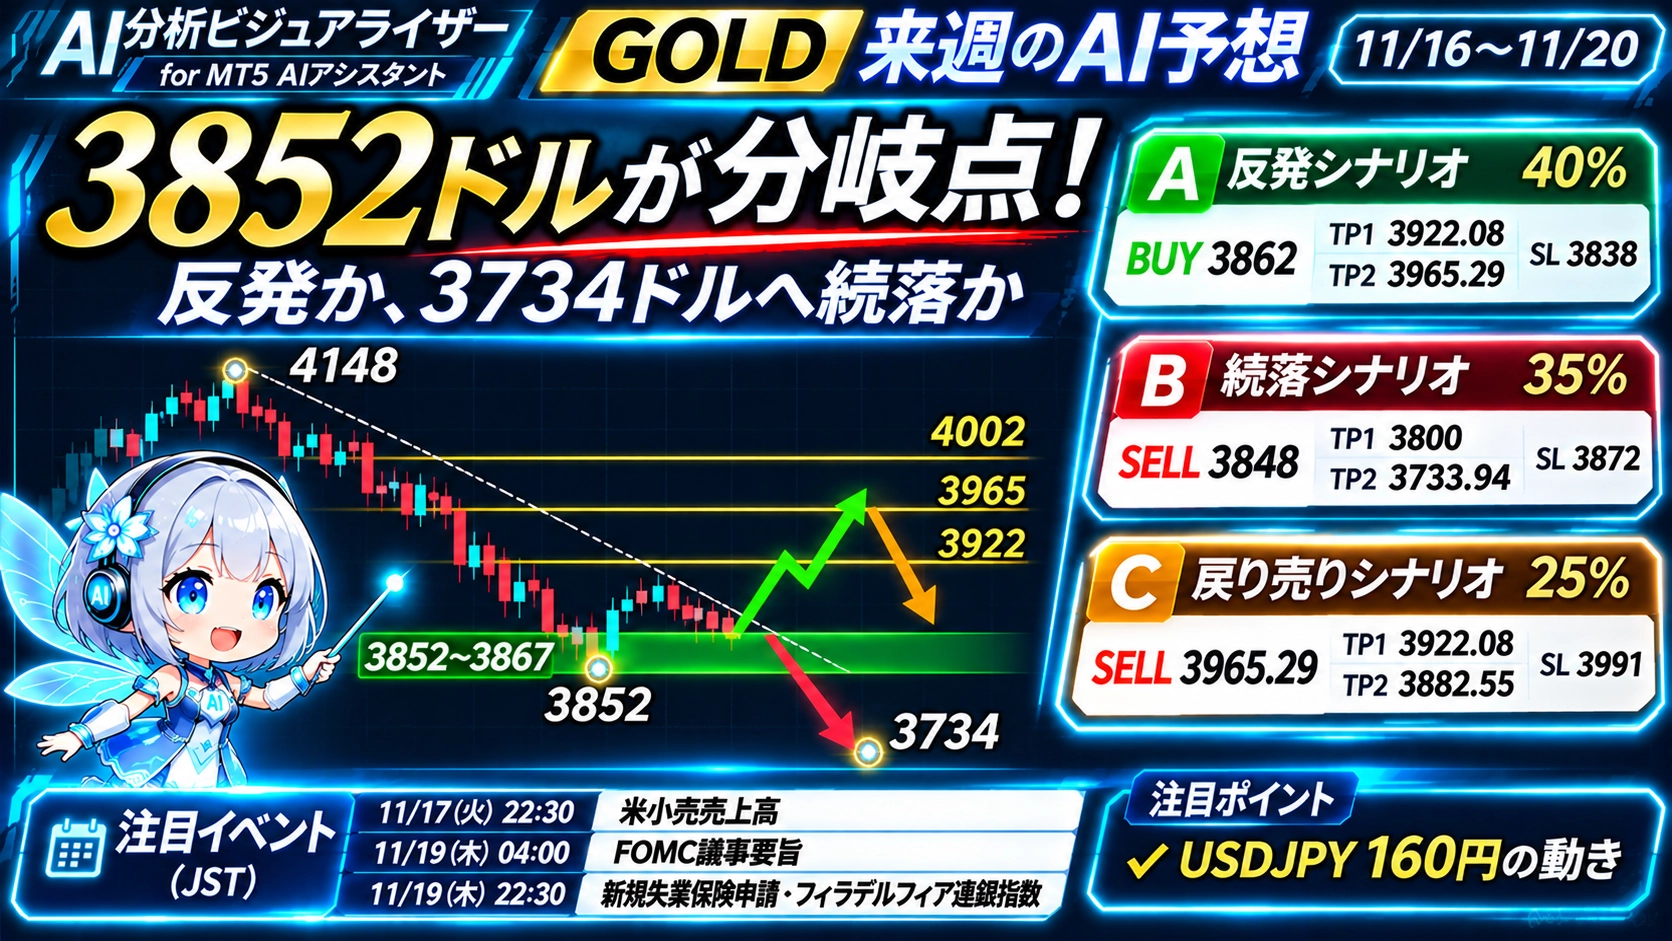
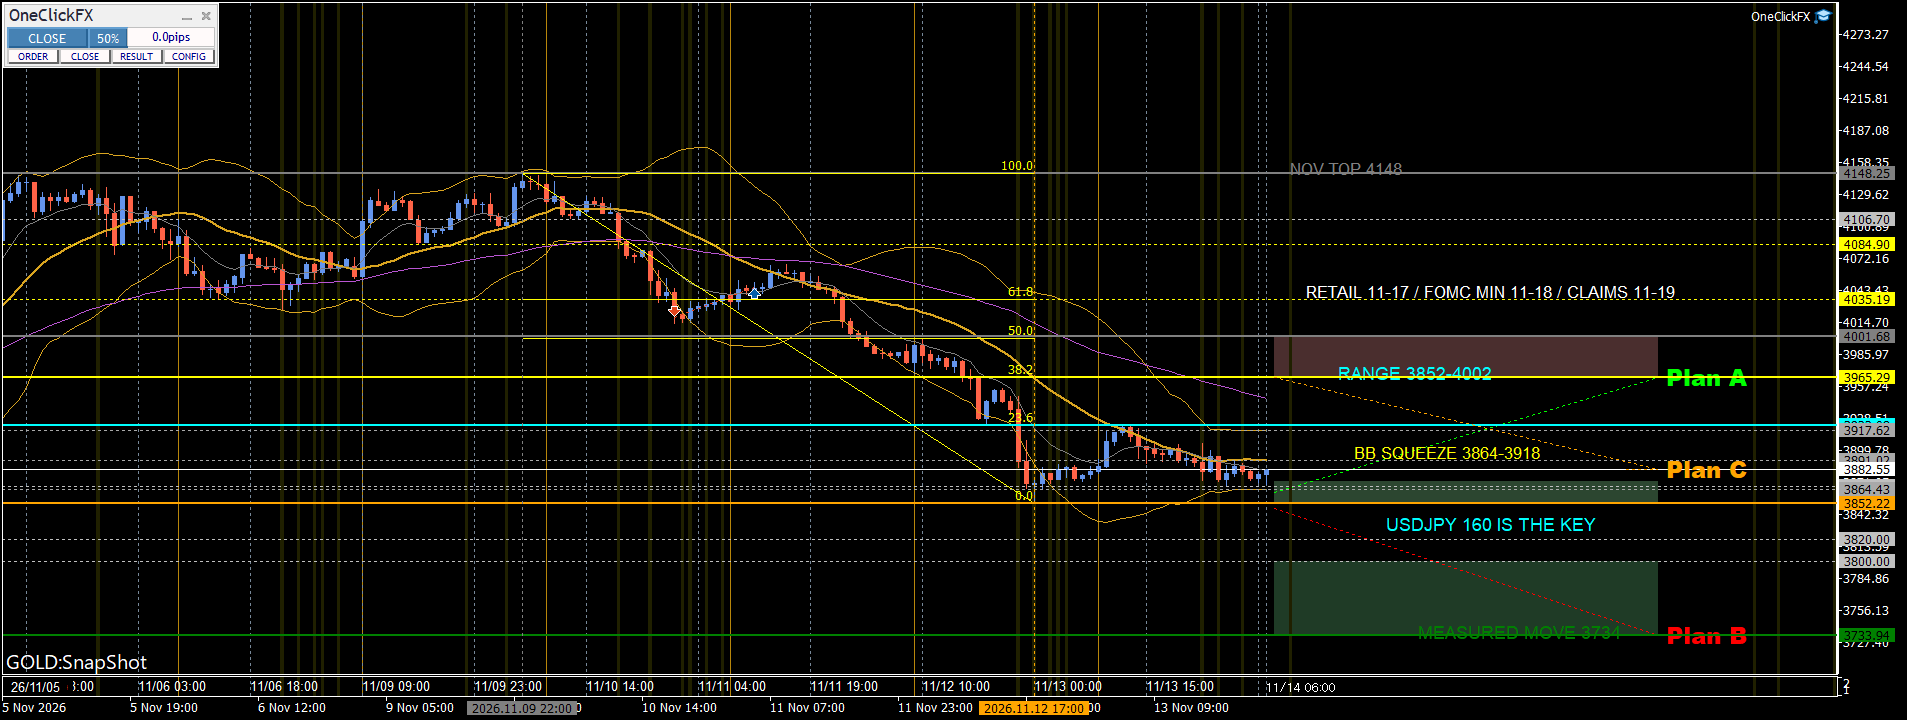
Next week, for GOLD, the divergence point is around $3,852, with three possible scenarios.
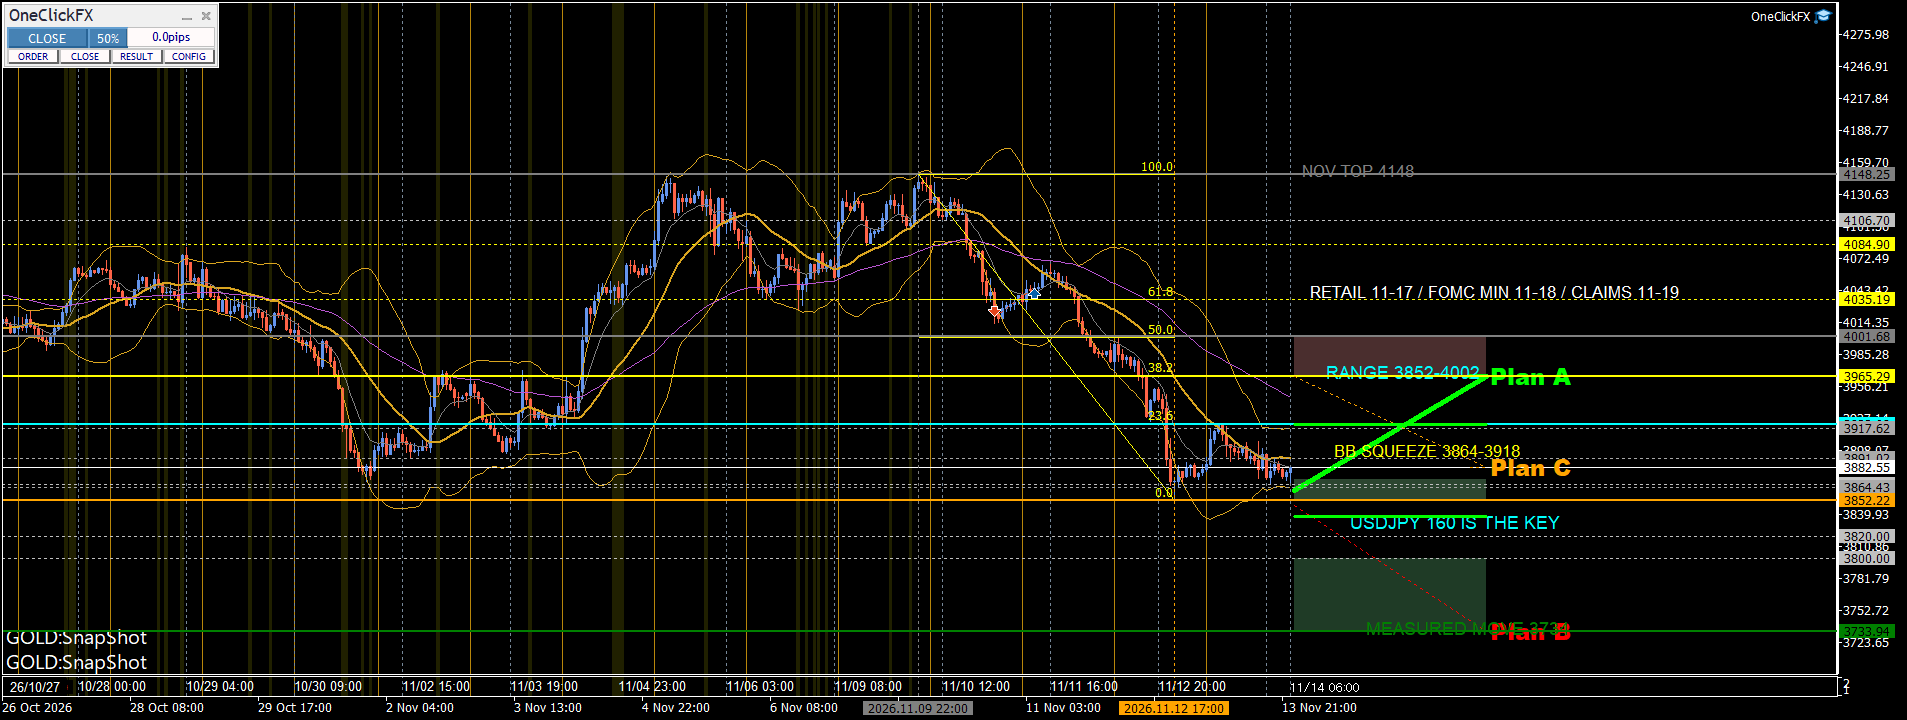
? Plan A: Hold at $3,852 and rebound (probability 40%)
A scenario where a double bottom forms between $3,852 and $3,867 and then rises.
- Entry: BUY at $3,862
- Stop loss (SL): $3,838
- Take profit (TP1): $3,922.08
- Final target (TP2): $3,965.29
First target is $3,922, then $3,965.
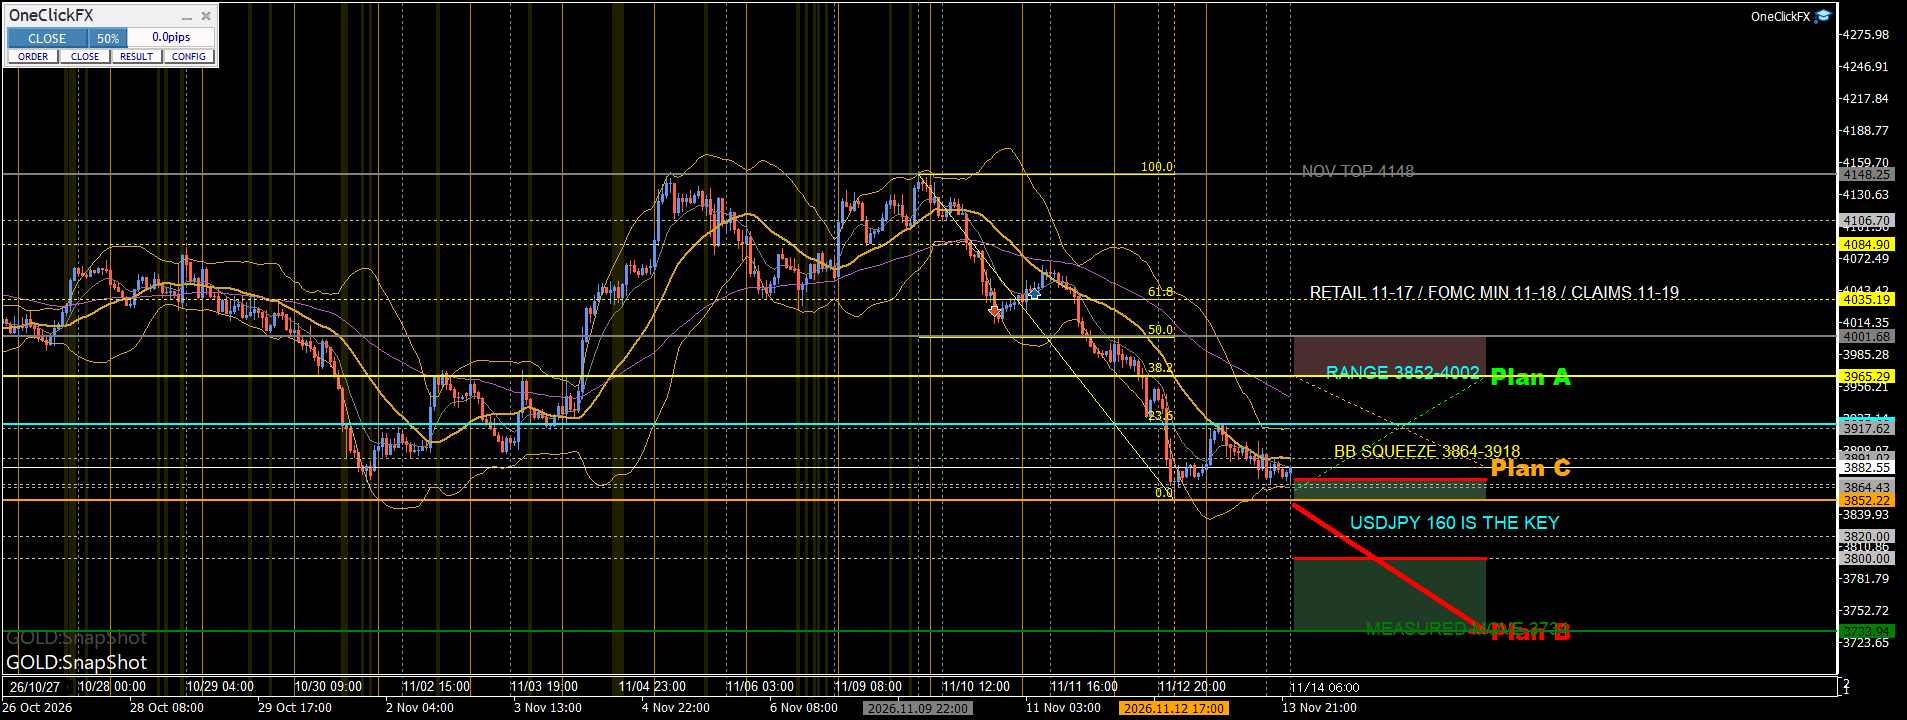
? Plan B: Break below $3,852 and continue to fall (probability 35%)
A scenario where support is breached and dollar strength accelerates decline.
- Entry: SELL at $3,848
- Stop loss (SL): $3,872
- Take profit (TP1): $3,800
- Final target (TP2): $3,733.94
After passing $3,800, the October-range-derived target of $3,734 becomes the final target.
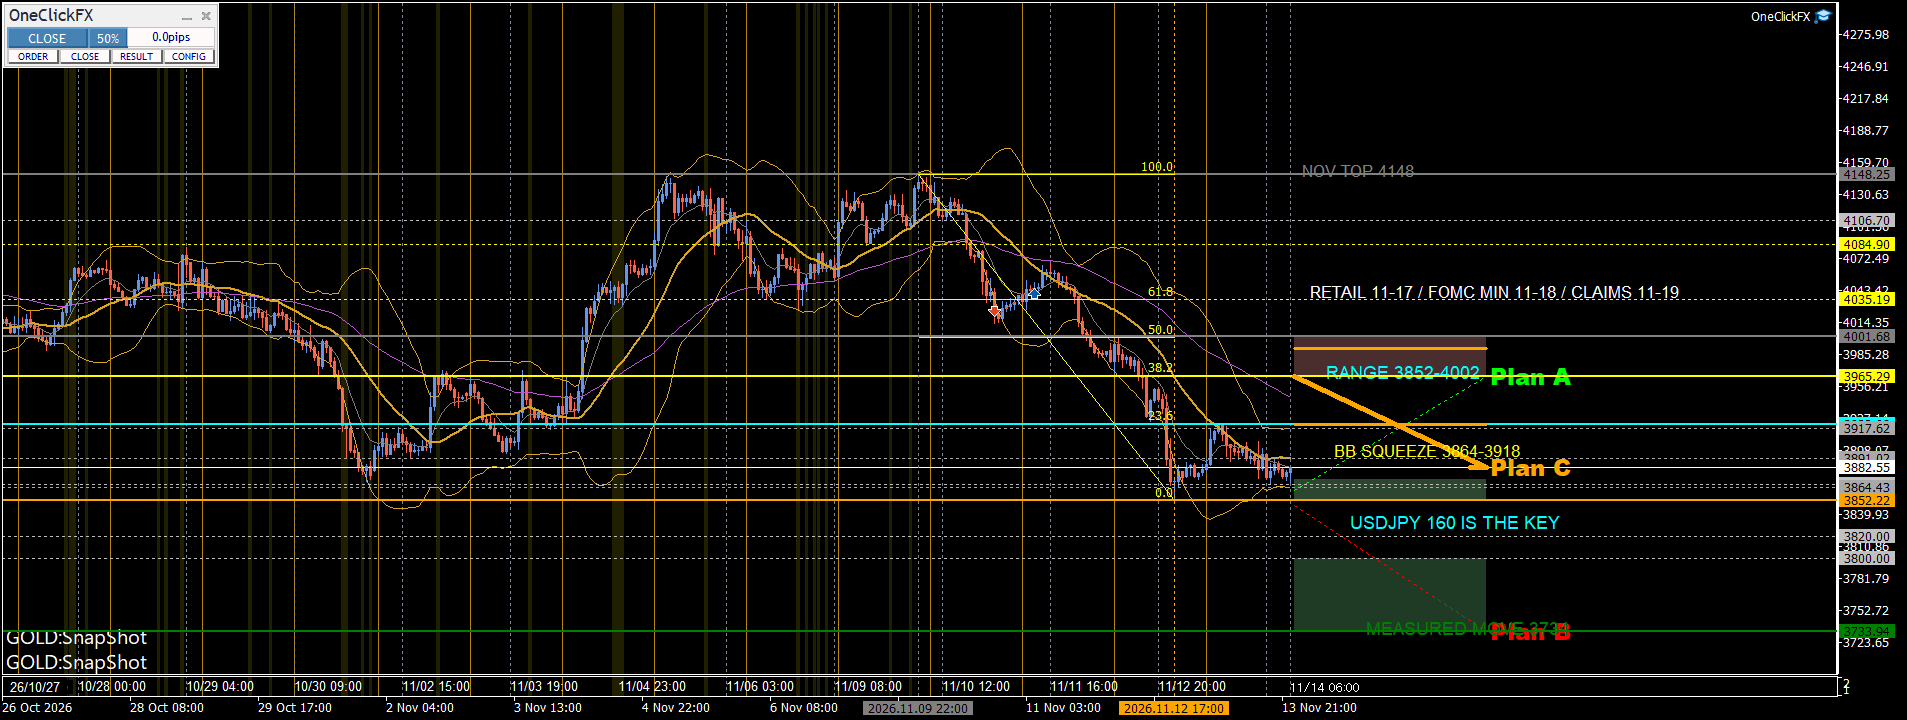
? Plan C: Rebound to $3,965 then fall again (probability 25%)
After rebound under Plan A, price stalls at the $3,965–$4,002 resistance band.
- Entry: SELL at $3,965.29
- Stop loss (SL): $3,991
- Take profit (TP1): $3,922.08
- Final target (TP2): $3,882.55
Aim for a rebound from around Fibonacci 38.2%.
④ How to proceed with trades and points to watch
The key point is whether $3,852 can be maintained at the outset.
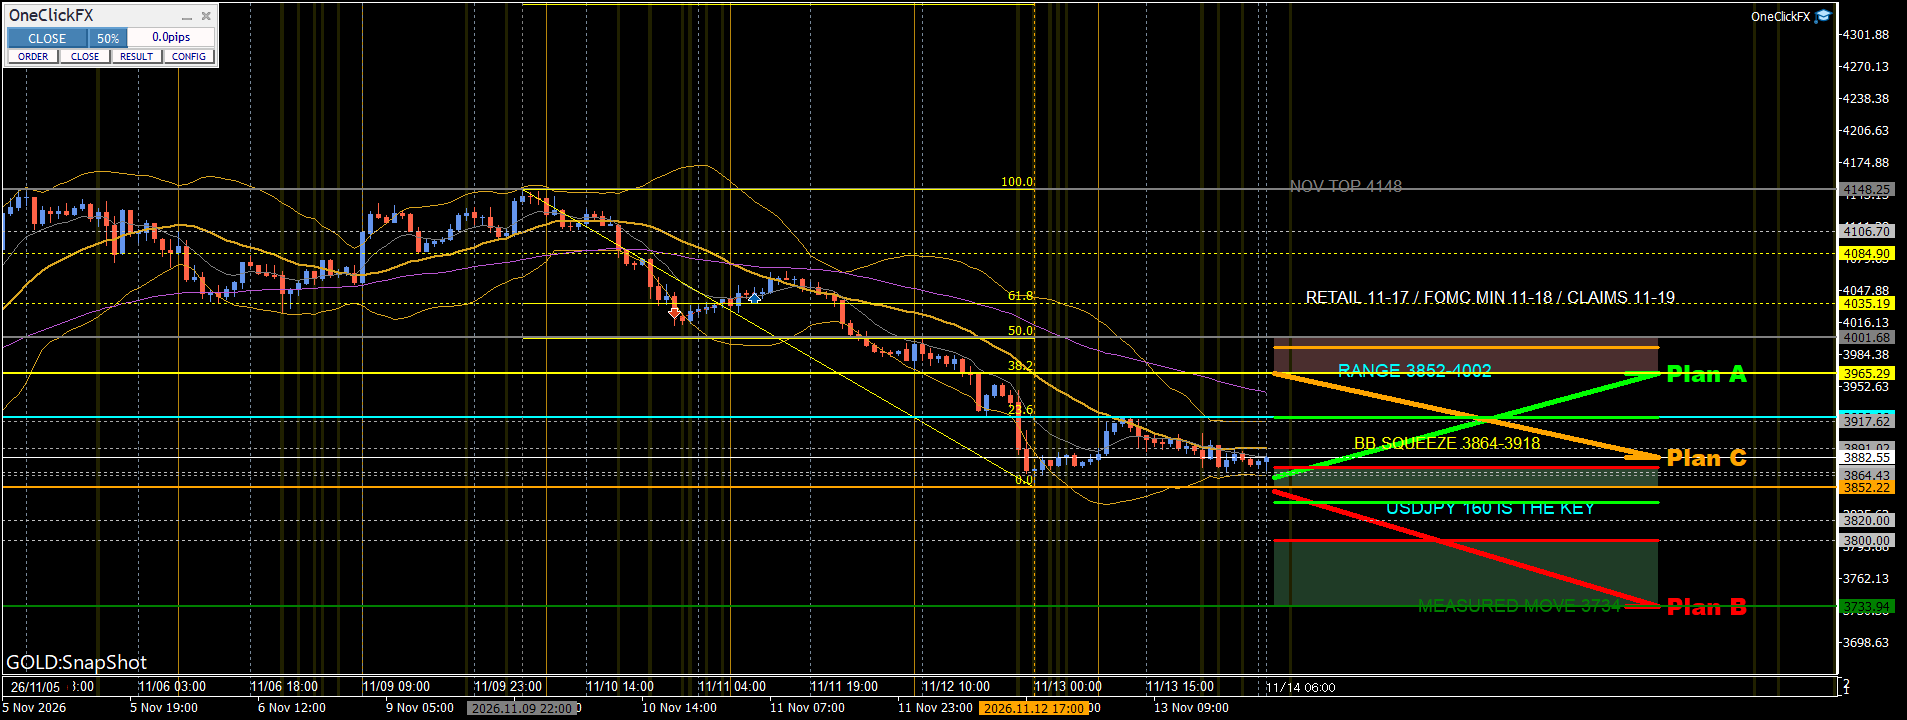
- Maintain $3,852: Plan A buy scenario
- Break below $3,852: Plan B sell scenario
- Plan A holds and rebounds toward around $3,965: Plan C rebound-sell scenario
Plans A and B are opposite and should not be pursued simultaneously. Plan C is the second stage after Plan A’s rebound progresses.
Also, the movement around 160 yen for USDJPY will be important. If dollar strength continues, focus on Plan B; if the dollar cools, focus on Plan A scenarios.
If a single plan reaches its target, reset there and do not chase the remaining plans.
⑤ Important economic events next week
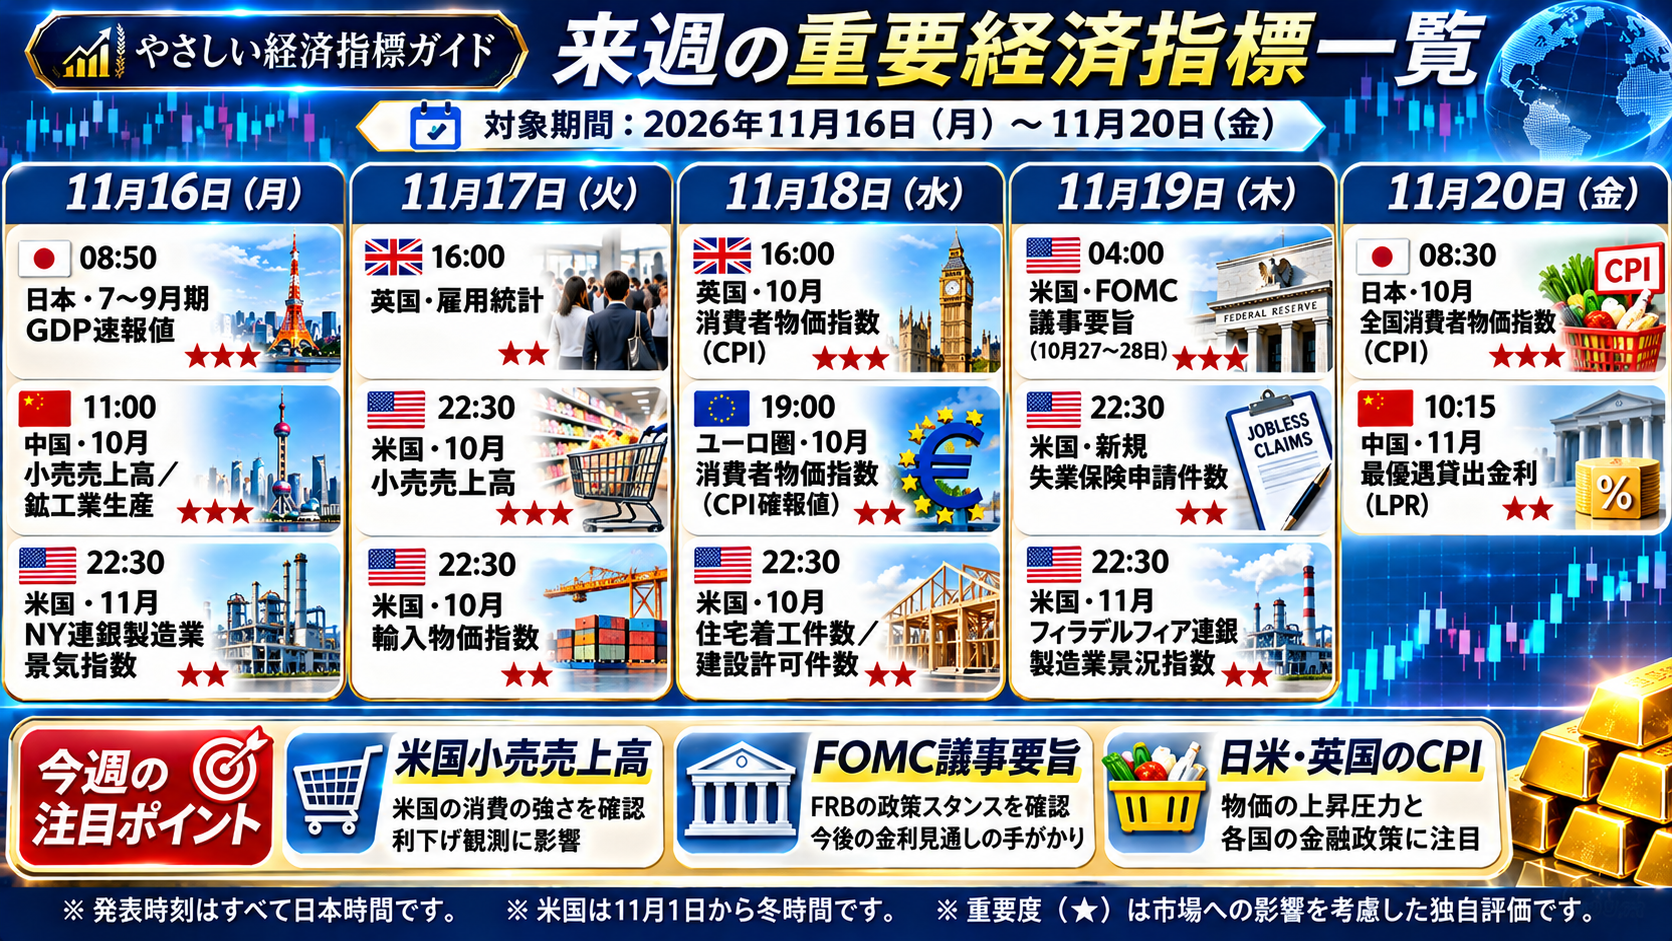
Next week, U.S. economic indicators and FOMC minutes are scheduled.
- November 17 (Tue) 22:30: U.S. Retail Sales(Previous +0.8% / Expected +0.3%)
- November 19 (Thu) 04:00: FOMC Minutes
- November 19 (Thu) 22:30: Initial Jobless Claims & Philadelphia Fed Index
The most important factor this time is the movement of the dollar.
Whether USDJPY will stay above 160 or retreat back around 160.
This movement is expected to influence the formation of a second bottom in GOLD and subsequent declines.
PPI for Friday rose 0.3% month-on-month (expected 0.4%), and 6.5% year-over-year (expected 7.3%), undershooting market expectations.
This result is one of the factors that could support GOLD's rebound.
⑥ Summary of this AI forecast
Next week, around $3,852 is the major pivot for GOLD.
This AI analysis envisions three scenarios as follows.
- Rebound from a second bottom: 40%
- Continue to fall after breaking $3,852: 35%
- Return to $3,965 and then drop: 25%
If $3,852 hold, attention will be on rebounds to $3,922 and $3,965.
If $3,852 breaks, downside targets could be $3,800 and eventually around $3,734.
Additionally, even on a rebound, strong resistance sits at $3,965–$4,002.
In light of last week's reflections, this time we not only focus on gold charts but also on USDJPY around 160 yen.

In this analysis, the MT5 AI Assistant organizes chart data read by AI into Fibonacci levels, moving averages, Bollinger Bands, key support and resistance, and three trading scenarios.
AI Analysis Visualizer for MT5 AI Assistantis a tool that visualizes these AI analysis results on the chart, allowing you to visually verify market conditions and trading plans.
Notes
This article presents market analysis and forecasts by an AI analysis assistant and does not constitute investment advice or guarantees of profit. The price levels and trading scenarios shown are those at the time of analysis and may change with market conditions. For actual trading, please check the latest charts, prices, spreads, etc., before making a decision.