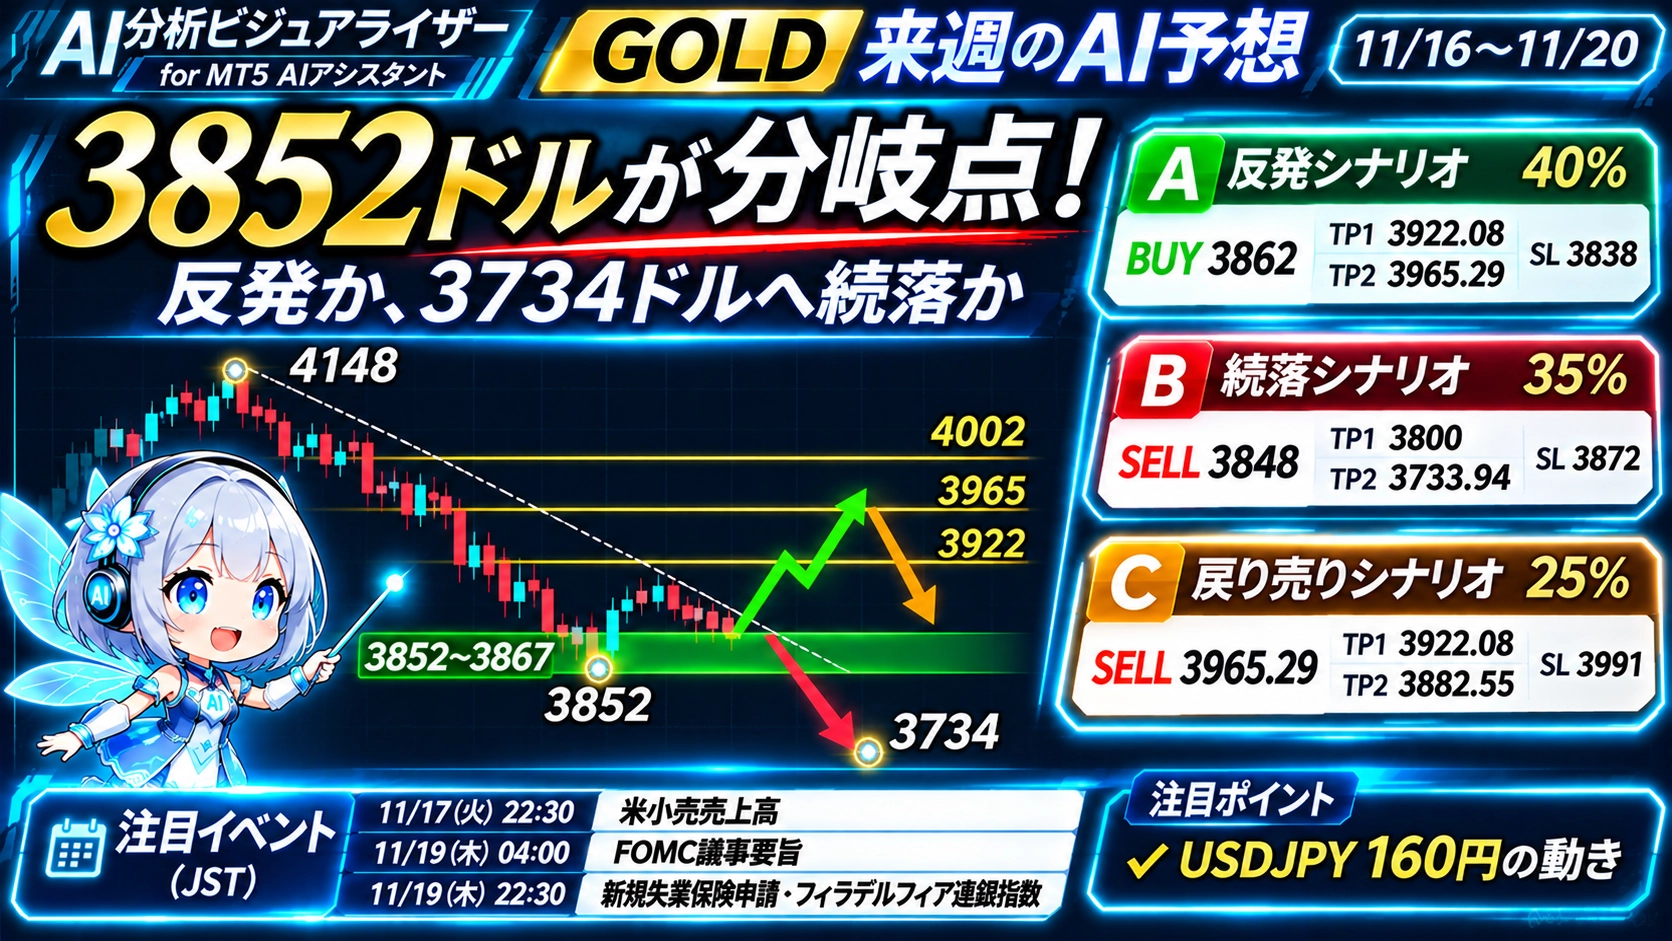

[GOLD AI Forecast Verification] Sharp drop from $4148 to $3852! Reviewing the 5 plans for the first and second halves of the week | November 9–13
?This article was posted on November 15, 2026=>Latest related articles?
This article presents the results of market analysis by MT5 AI Assistant visualized throughAI Analysis Visualizer. It is an analysis based on chart data at specific times by AI and does not guarantee future prices or profits.

① Review of last week's market: nearly a full retracement of the election-week gains
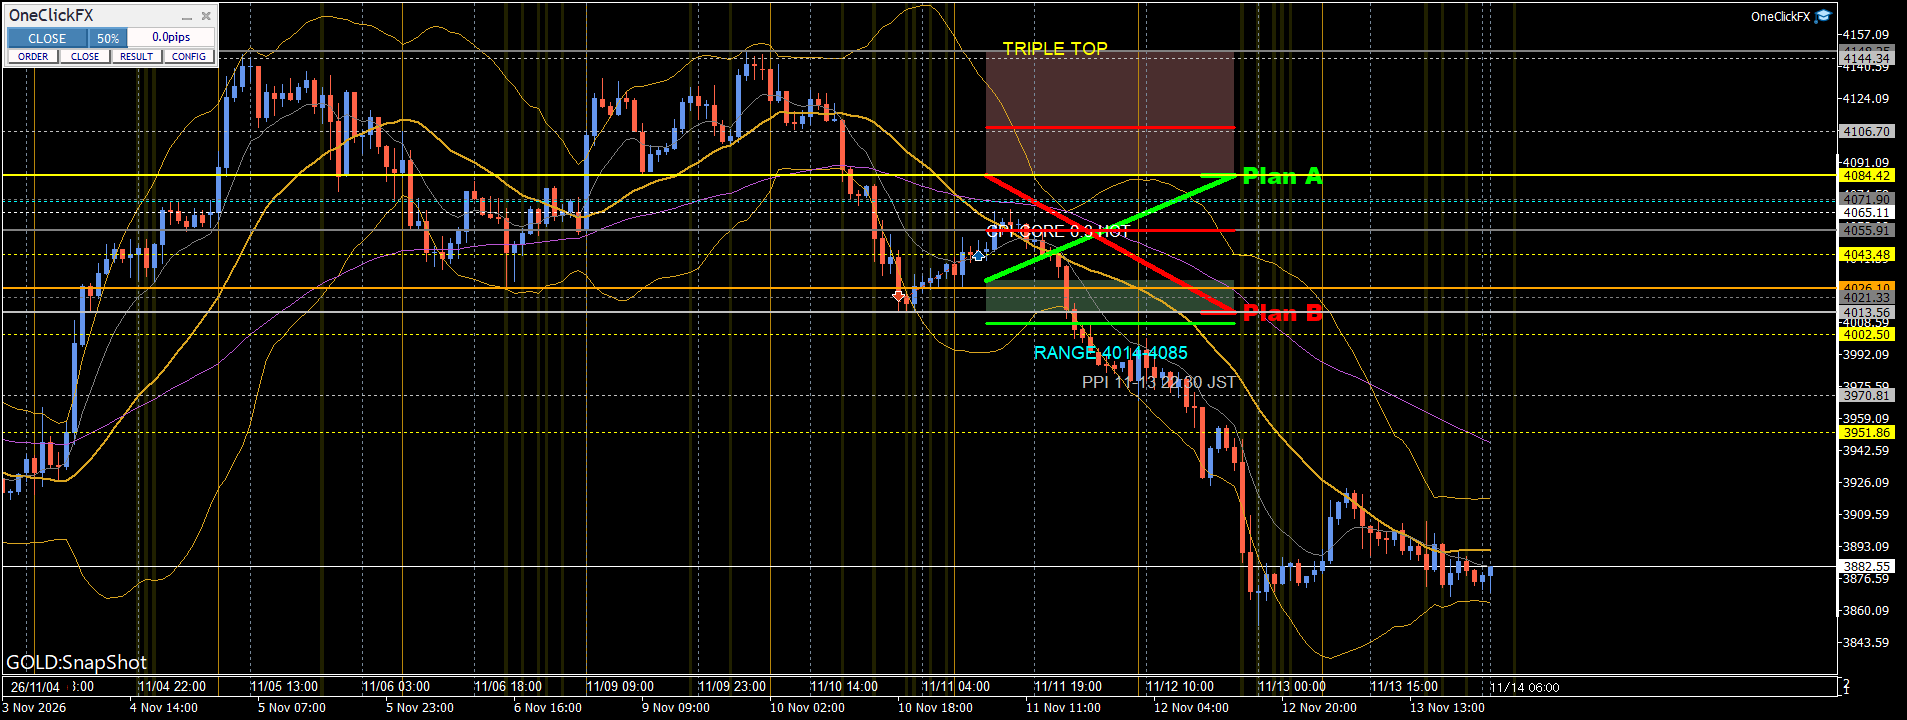
Last week, GOLD fell from 4065.11 to 3882.55 dollars by week’s end.
On November 9, it rose to 4148.25 dollars, but then fell, dropping to 3852.22 dollars on November 12, nearly retracing the prior week’s gains.
What stood out was the movement of the dollar.
USDJPY rose from the 157s to the 160s, and dollar strength accelerated the decline in gold prices.
Dollar strength progressed after the core CPI beat expectations on November 10, accelerating gold’s decline by Thursday.
Meanwhile, Friday’s PPI came in below expectations, and GOLD traded in the range of 3867.40–3922.82 dollars.
With this decline, gold again became strongly influenced by the dollar.
② AI forecast for the first half of the week: three trading plans
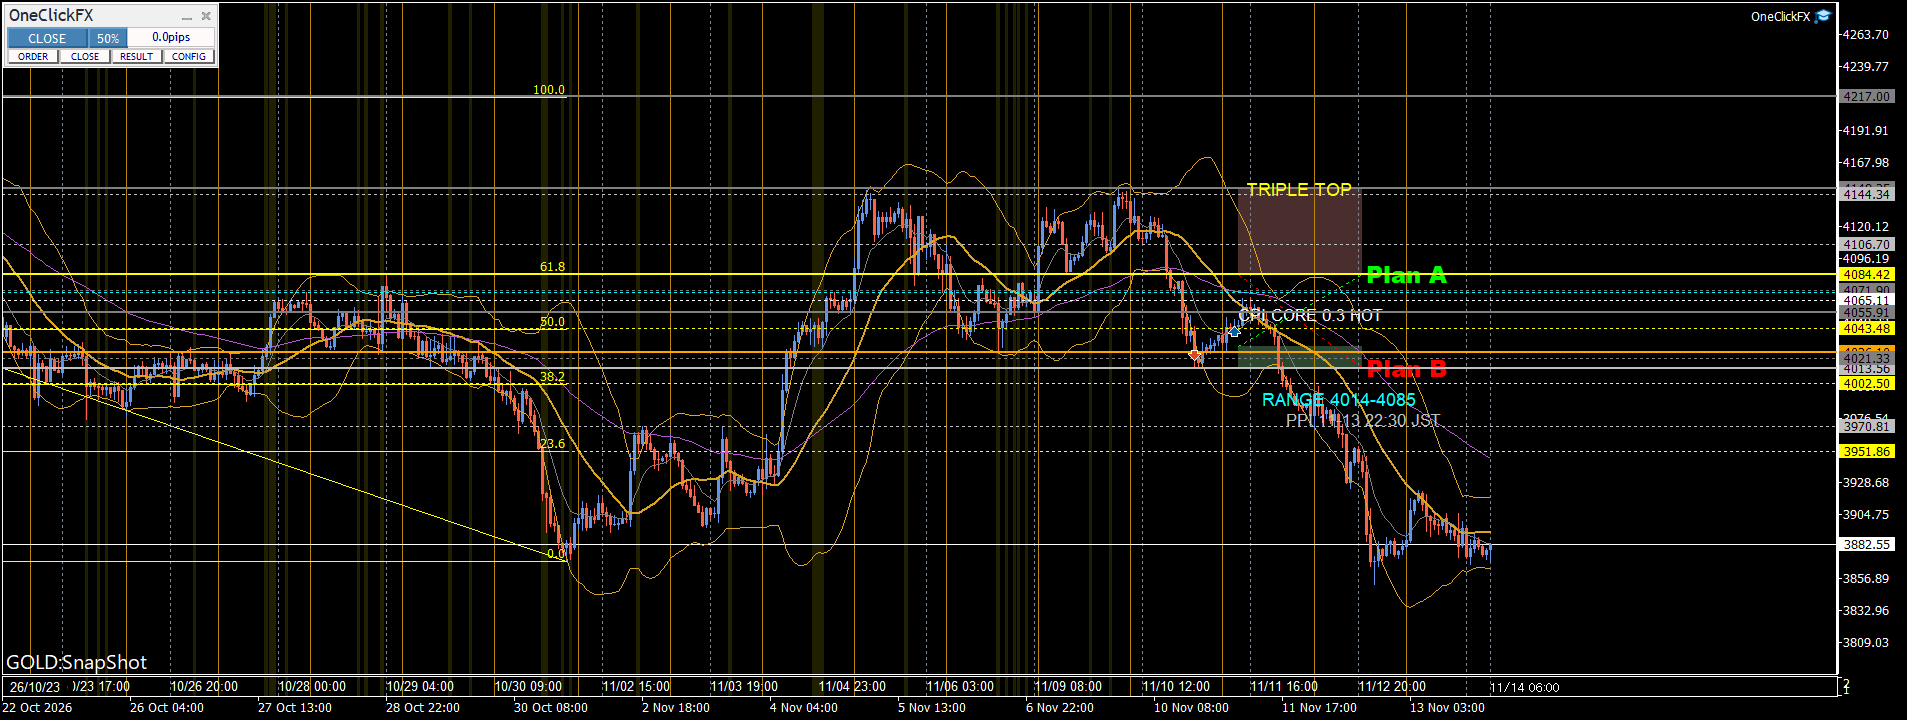
In the weekend analysis, while basing on a weekly-reversal backdrop and an expectation of a dip-buy around 4147 dollars, a fall from around 4147 and further decline if support broke were also anticipated.
Plan A: Dip-buy
- BUY: 4045 dollars
Plan B: Counter-trend sell from the highs
- SELL: 4146.80 dollars
- TP1: 4084.42 dollars
- Final settlement: 4043.48 dollars
- SL: 4176 dollars
Plan C: Follow-through sell on support break
- SELL: below 4026 dollars
Result
Plan B peaked at 4148.25 dollars and then retraced, reaching two take-profit targets. Maximum drawdown was about 1.45 points, largely as designed.
③ AI forecast for the latter half of the week: two plans assuming a range
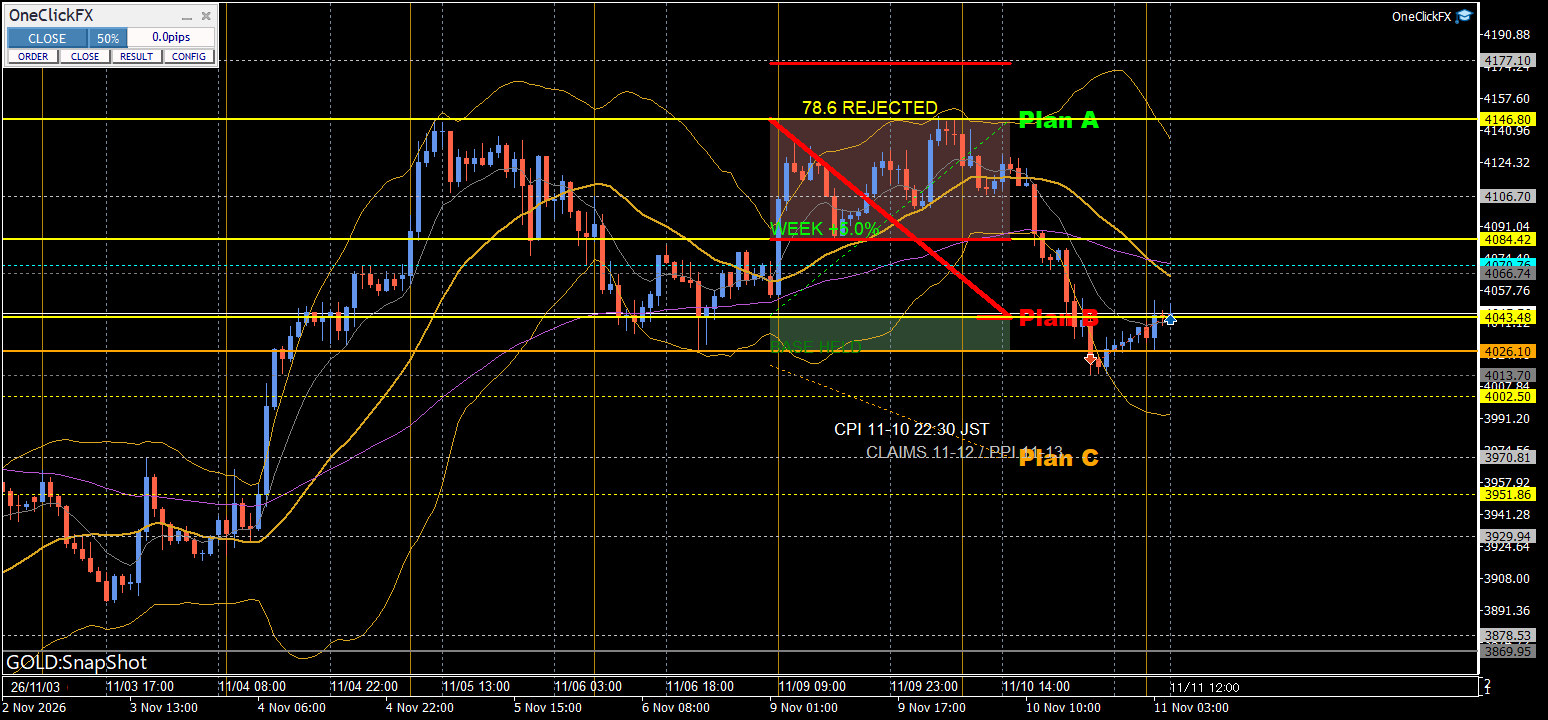
On Wednesday, after reanalyzing market conditions, a new plan was set assuming a 4014–4085 dollar range.
Plan A: Buy from the lower edge of the range
- BUY: 4030 dollars
- SL: 4008 dollars
Plan B: Sell from the upper edge of the range
- SELL: 4084.42 dollars
- SL: 4109 dollars
Result
- Plan A: filled on November 11 with stop-out, −22 points
- Plan B: did not reach selling level, unfilled
Thereafter, as the Wednesday close breached the range lower bound, the remaining plans were discarded and reanalysis rules were triggered.
As a result, while the anticipated range market did not hold, losses were limited to 22 points.
④ Summary of the week’s validation
In this market, Plan B, which captured the retracement near 4148 dollars in the first half of the week, performed.
In the latter half, although a range continuation was expected, a downside breakout occurred, Plan A was stopped out, and Plan B remained unfilled.
A lesson learned is that the dollar-strength scenario was not sufficiently incorporated into the plan.
It was reaffirmed that not only the gold chart but also movements of the dollar, such as USDJPY, need to be considered in judgment.
Also, even if market expectations miss, the predefined exit rules helped limit losses, which is important.
AI forecasts are not only about predicting up or down; it is important to set multiple scenarios and concrete exit conditions and verify them against actual price movement.

In this validation, we compared the early-week and late-week analyses by the MT5 AI Assistant with the actual GOLD price movements.
AI Analysis Visualizer for MT5 AI Assistantis a tool to visualize such analysis results and trading scenarios on charts.
Notes
This article introduces market analysis and forecasts by an AI analysis assistant and does not guarantee investment advice or profits. For actual trades, please check the latest charts, prices, spreads, and other factors before making judgments.