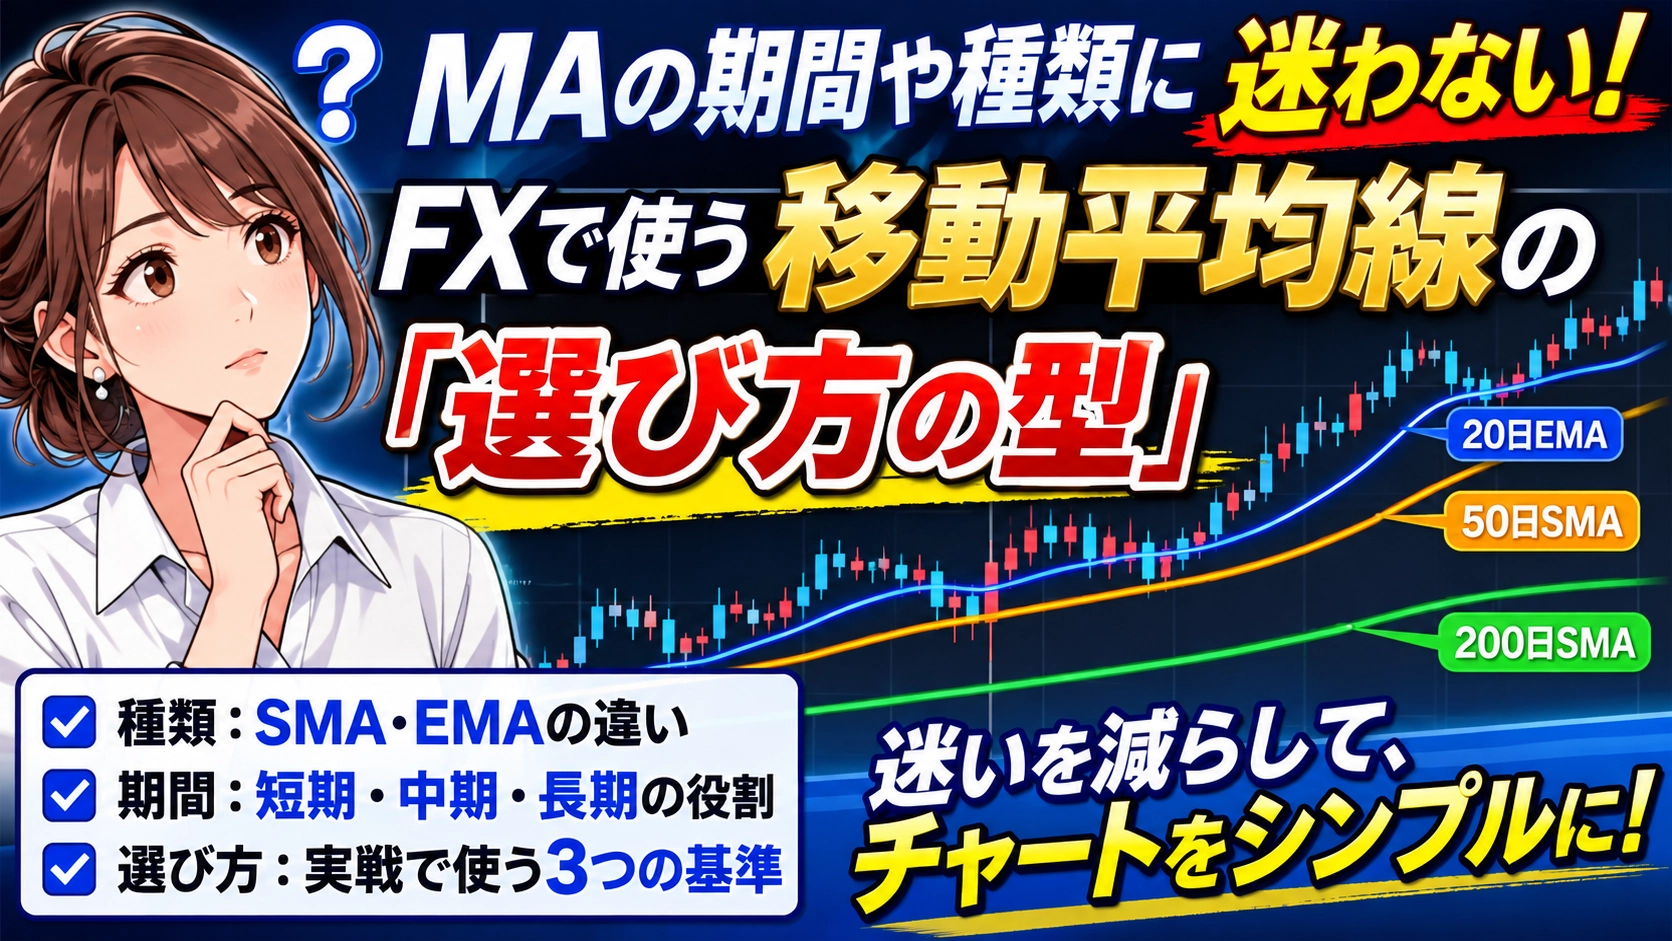

Do not hesitate about the period and type of MA! The "choice pattern" for moving averages used in FX
“20 days? 25 days? EMA? SMA?” — It’s natural to be unsure. However, if you narrow the criteria for choosing to three, the charts become surprisingly simple.
Introduction Proposal
Moving averages (MA) are one of the most commonly used technical indicators in FX.
But when you actually try to set them up,SMA or EMA, 20 days or 25 days, 50 days or 75 days, you end up hesitating, don’t you?
In short, there is no “one true answer” for the period or type of MA.
What matters isto fix a small number of settings that match your time frame, trading style, and the length of the trend you want to see.
Moving averages are basic indicators that smooth price action to visualize the direction and strength of a trend and the average cost.
In this article, to reduce confusion, we will clearly determine the following three points.
Type: Differences among SMA, EMA, and WMA
Period: Roles of short-term, mid-term, and long-term
How to choose: Differences between Japanese and Western methods and the minimal practical setup
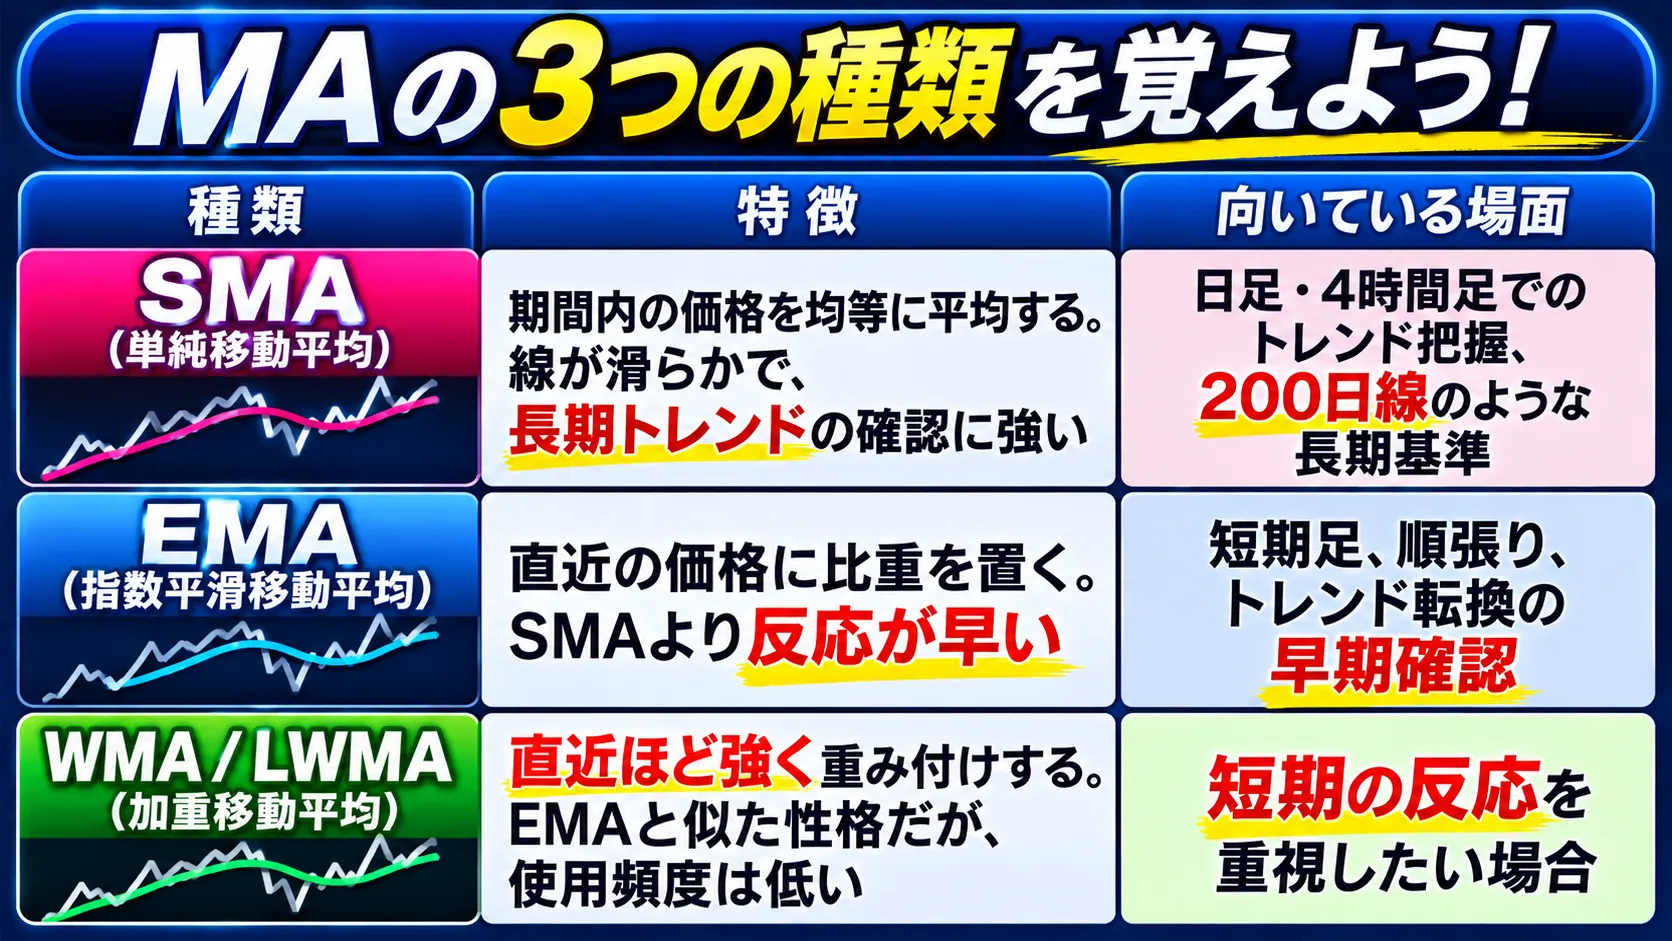
Moving averages have various calculation methods such as SMA, EMA, and WMA, and each line moves differently. However, if you’re using them in practice for the first time,two types, SMA and EMA, are sufficient. You don’t need to go as far as WMA.
A survey of 700 Japanese FX traders found that for the question “Is the moving average EMA or SMA?”,EMA was 54.5% and SMA 45.5%. EMA had a slight edge, but the difference is not large.
First Choice Method
You want to see the “skeleton” of the trend→ SMA
You want earlier entry reactions→ EMA
You want to use both→ Long-term SMA, short-term EMA
For example, use a daily chart to confirm the overall flow with “200-day SMA,” and target pullbacks around the “20 EMA” on a 4-hour chart. A setup that narrows the long-term direction with the short-term timing.
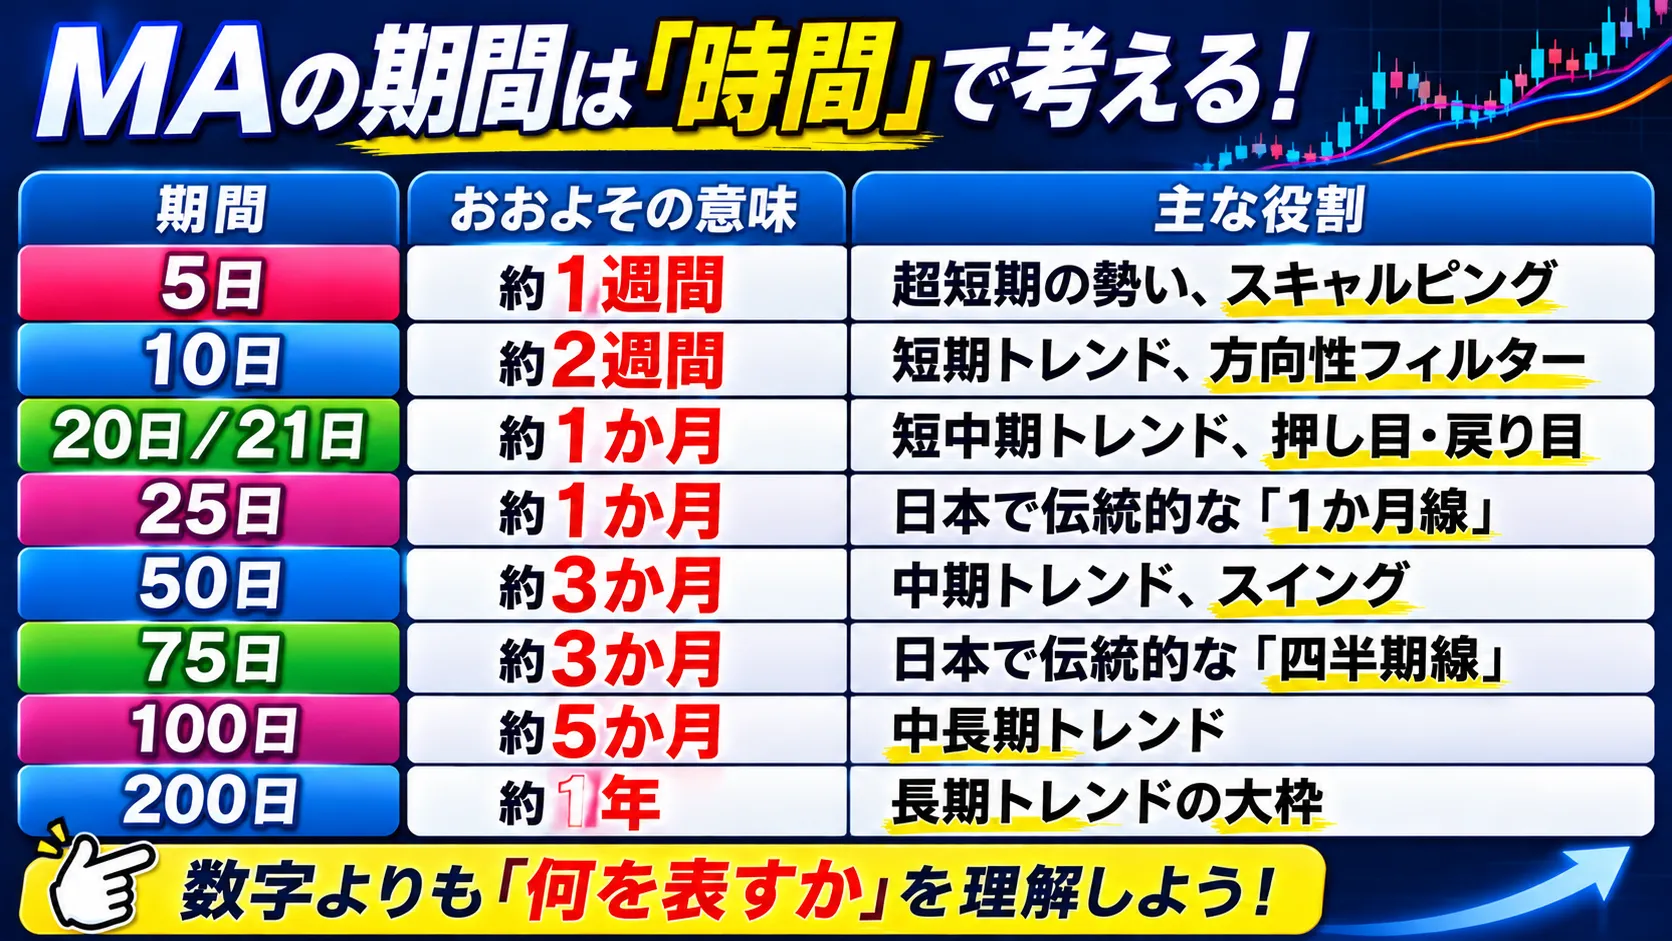
In Japan, the traditional configuration is 5-day, 25-day, 75-day, and 200-day. The 5-day corresponds to about one week, 25 days to about one month, 75 days to about three months, and 200 days to about one year.
On the other hand, overseas, 20-day, 50-day, and 200-day are commonly used, with the 50-day serving as a mid-term guide and the 200-day as a long-term trend reference.
In other words,25-day and 20-day, 75-day and 50-day are essentially the same in function.
Instead of worrying about which is superior, choose the one that is easier to read on your chart and consistent with your other settings.
Differences Between Japanese and Western Styles
| Style | Standard Configuration | Characteristics |
|---|---|---|
| Japanese style | 5-day, 25-day, 75-day, 200-day | Time senses like week, month, quarter, year are easy to understand |
| Western style | 10-day, 20-day (21-day), 50-day, 200-day | Focus on “round numbers” like 20, 50, 200 |
| Practical for trading | 20-day (or 21-day), 50-day, 200-day | Easier to organize short-, mid-, long-term with three lines |
The popularity of moving averages in Japan is closely related to the concept of “Granville’s Rules” proposed by American chartist J. E. Granville.
Granville promoted trading decisions using the 200-day moving average and popularized the idea of reading buy/sell points from the relationship between moving averages and price.
In Japan, however, configurations of 5, 25, and 75 have long been used in securities companies and educational materials.
As a result, many Japanese stock charts are accustomed to the 25-day and 75-day lines, and this culture has been inherited in FX as well.
Three Principles to Avoid Confusion
When you’re unsure about MA settings, just confirm these three things.
Decide your time frame first
For 1-minute or 5-minute charts, use 5, 10, 20
For 15-minute or 1-hour charts, use 20, 50
For 4-hour or daily charts, use 20, 50, 200
Avoid overlapping roles
Showing 20-day and 25-day at the same time is largely redundant
The same applies to 50-day and 75-day
Limit to the three roles of short-, mid-, and long-term
Don’t mix too many types
Start by focusing on either SMA or EMA
A useful allocation is long-term trend with SMA and short-term reaction with EMA
Moving averages become more lagging as the period lengthens.
The 200-day MA has more delay than the 20-day MA, but it more reliably indicates the direction of the long-term trend.
In other words, the shorter the period, the faster, and the longer the period, the more stable — understanding this trade-off is important.
My Recommended Initial Settings
If you’re unsure in FX, start with the following three lines.
20-day EMA: Short- to mid-term pullbacks, entry reference
50-day SMA: Confirm mid-term trend
200-day SMA: Direction of long-term trend, a filter to reduce false signals
With these three, you can create a flow of “don’t go against the long-term direction,” “wait for mid-term pullbacks,” and “enter on short-term reactions.”
The 20, 50, and 200 days are conventional daily-chart conventions in many cases and are not necessarily proven optimal by backtesting, but
since many participants look at the same lines, they tend to function as support and resistance.
Common Mistakes
Displaying more than five moving averages: too many lines; you won’t know which to prioritize
Not looking at the long-term line while focusing only on short-term: leads to more entries that go against higher-timeframe trends
Alternating between SMA and EMA: prevents verification and reproducibility
Using only crossovers as trading signals: in ranges, false signals can occur repeatedly
Chasing the “strongest period”: optimal period changes by market, timeframe, and currency pair
Moving averages are simply tools to visualize trends.
They do not guarantee entries themselves; it’s important to use price position, trend direction, and alignment with higher timeframes together.
Summary
Start with only SMA and EMA; that’s enough
Limit to three roles: short-, mid-, and long-term
Japan-style is 5, 25, 75, 200; Western-style is 10, 20, 50, 200as a guide
Initially, 20-day EMA, 50-day SMA, and 200-day SMAare safe bets
If unsure, fix the time frame and role rather than increasing the number of lines
The reason you’re unsure about MA isn’t the number of settings, but“why you are looking at that line”is not determined.
First narrow to three lines at most, and verify the response through at least 100 trades. That’s the fastest route to mastering MA.
If you’ve read this far and think, “I understand the settings, but how do I actually use them on real charts?”
I use moving averages not only as a basis to confirm trend direction but also as part of entry decisions and as a filter.
If you want to try the approach described in this article in your actual chart environment, you can check my tools from the page below.
▼ My Current Tools for Sale
https://www.gogojungle.co.jp/users/723932?via=mypage_header