

【BB's Mechanism ①】 Once you pass through the resistance you were aiming for. Use the expansion of BB as a basis for judging the strategy
“If this price breaks above this high, I want to consider buying.” Even if you have decided where to wait on the chart, when a large candlestick actually appears, you hesitate whether to enter now or wait for a pullback.
To set up a breakout after waiting, first determine the resistance level, then verify the expansion on the chosen time-frame pair. BB Watch developer “Namikoro” explains this sequence using BTC real charts.
First, decide the high you want to see break
Looking back at BTC/USD in August 2026. On Kraken’s daily chart, after a decline from the May high region toward the end of June, price recovered. The resistance candidate is the high of June 15 at 67,263.5 dollars.
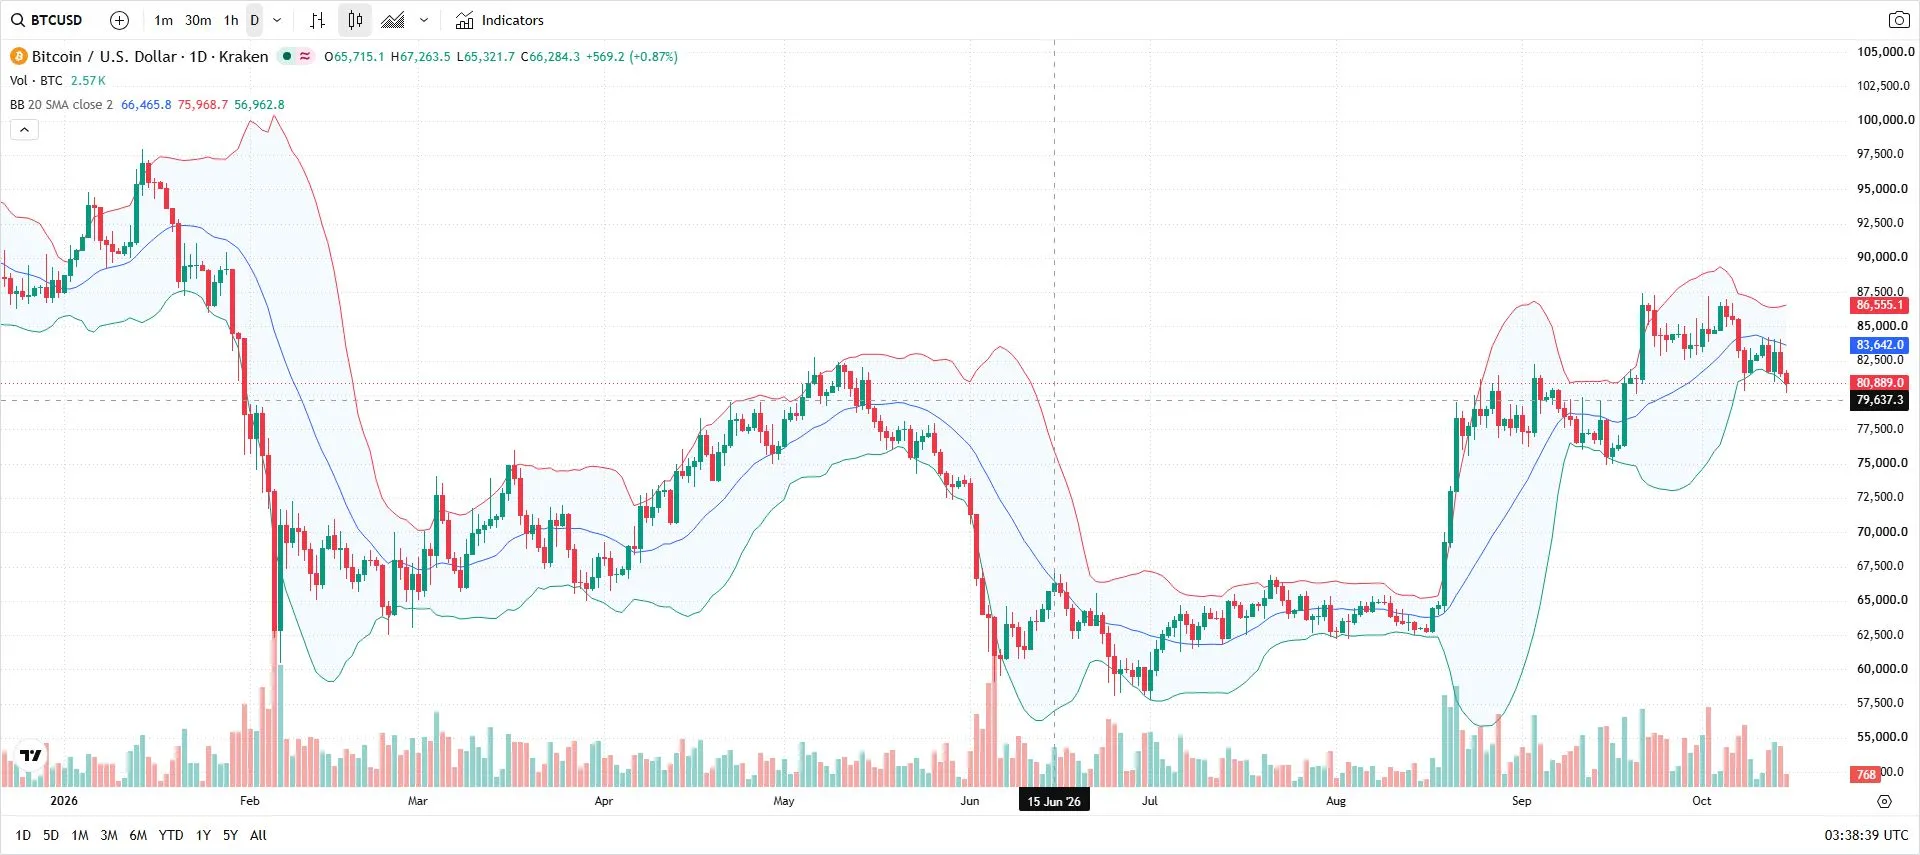
Daily background. The vertical line marks June 15, 2026, confirming the high of 67,263.5 dollars. From May’s decline and the subsequent rebound, identify the high you want to be conscious of.
KRAKEN:BTCUSD / Charts by TradingView(https://www.tradingview.com/)。Dates and times are UTC. The vertical lines and date labels on the candles are the targets for confirmation.
From the breakout of this rebound high, we aim for an upward move on the 4-hour chart. If you pre-select such a setup, the point to wait for the pair’s expansion is determined. The move above the high will serve as the basis for entering on the 1-hour and 15-minute expansions.
For example, when aiming for the 4-hour wave, you can view the 1-hour and 15-minute candles as a paired view. As price advances in the direction you target, the BB expansion in this pair becomes the basis for entry. This is an example of capturing the growth of the 4-hour wave from the movements of the 1-hour and 15-minute candles.
The combination of time frames should be chosen to fit your method and the wave you aim for. If you’re targeting a 15-minute wave in scalping, you might use a paired expansion of 5 minutes and 1 minute. This article explains the procedure using the example of targeting the 4-hour chart.
First, decide which time-frame wave you want to capture with your method. The price should be in a setup where you can consider a breakout or a retracement wave after a range break or a trend reversal. Once the target area and direction are decided, wait for the pair’s expansion.
BB Watch is a tool that allows you to arrange and compare the width of BB and its changes for the selected time frame in a Windows screen. By lining up the chosen pairs, when the price you were waiting for arrives, you can compare changes in real time. This time, we will consider the steps up to entering based on real-chart scenarios.
As the breakout moves beyond resistance, the 4-hour BB also expands
The 4-hour period from 12:00 to 16:00 on August 19 started at 64,456.4 dollars and ended at 68,539.7 dollars. The high was 69,577.2 dollars. It surpassed the June 15 high, and the close was above it.
At this time, BB width expanded from the previous 08:00 wick’s 2,565.9 dollars to 4,692.5 dollars. The growth rate was about 82.9%. The upper band moved up, and the lower band moved down.
While this 4-hour candlestick was moving, the latest confirmed daily candle was August 18. The daily BB width had expanded by about 3.3% compared to the previous day. By confirming the daily changes, it was a moment to focus on the 4-hour candle that could break through the resistance.

4-hour candle from August 19, 2026, 12:00 to 16:00. Close price 68,539.7 dollars, BB upper 66,511.4 / BB lower 61,818.9 dollars. It closed above the June 15 high of 67,263.5 dollars.
KRAKEN:BTCUSD / Charts by TradingView(https://www.tradingview.com/)。Dates and times are UTC. The vertical lines and date labels on the candles are the targets for confirmation.
The approximately 82.9% mentioned here is a confirmed value obtainable after 16:00. It does not mean that this figure was visible the moment the resistance was broken.
Enter at breakout or wait for a pullback
So far, the measured data have been on the daily and 4-hour charts. If you want to target another breakout of such rebound highs, how will you use the 1-hour and 15-minute pairs? Here are the steps from this point.
When price breaks above a resistance candidate like 67,263.5 dollars, compare the 1-hour and 15-minute candles. If price moves upward and expansions appear on both candles, this movement becomes the justification to enter on the 4-hour uptrend.
The pair synchronization here means expansions on both the 1-hour and 15-minute candles. Even if the price breaks the high, if only the 15-minute expands and the 1-hour does not, beware a pullback after the breakout. Do not chase the buy; wait to see if the price can stay above after the breakout and whether the pair expansion aligns.
Thus, selecting breakout moments by pair is a way to “assist in avoiding a false breakout.” By comparing both candles with BB Watch, you can decide whether there is a reason to enter now or to wait a bit longer.
Once the pair conditions align, check the distance between the entry and stop-loss. Adjust the position size based on that distance to ensure the risk limit is within your plan.
If price has already moved significantly and the stop-loss distance is large, wait for a pullback. When the price stops around, or above, the breached level and tests higher again, confirm the 1-hour and 15-minute expansions. Reconsider whether you can participate from a level you can tolerate.
After buying, monitor whether the price can hold the breached level. If price returns to the original range and stays below the resistance, reconsider the long thesis. Even if BB width remains large, continue to verify whether the price still meets your buying criteria.
Decide the wave to target on the 4-hour chart, and use the 1-hour and 15-minute expansions as the basis to enter. After entering, use the breached price to confirm the ongoing justification for buying. This sequence links pair changes to trading decisions.
Even when making judgments on candles forming mid-way, the order of viewing remains the same. Use the current price and BB values, and manage it with the possibility that changes may revert later. Whether to wait for candle confirmation should follow your own trading rules.
What you learn when BB expands
BB width is the distance from the upper band to the lower band. With an upper and lower band set at 2σ each, the width equals 4σ. The dispersion of prices used in calculations increases the width.
However, expansion alone does not tell you whether the move is up or down. Therefore, read whether price moved higher after breaking resistance or collapsed downward in conjunction with price.
Also, “width is large” and “width is currently expanding” are different states. Even when contracting, a wide width can remain. BB Watch lets you compare width and its changes, so you can evaluate more than just the chart’s appearance and see how it changed from the previous moment.
For those who already have a target location
Aim to capture waves that break out of a range or the retracement wave after a trend has ended, using a time frame that suits your method. When price reaches that moment, use the selected pair’s expansion as the entry basis. If you line up this pair in BB Watch, it makes it easier to connect chart-determined targets with entry decisions.
When the high you were targeting breaks, changing time frames can delay your judgment. In such cases, align the time frames in BB Watch. Compare the price-moving chart with each time frame’s BB changes to reassess your prepared setup. See product pages for display and usage instructions.
Line up the target time-frame pair to capture entry changes. See BB Watch’s display and usage
Confirming the decision after entry on the real chart
Target the breakout-driven wave and evaluate whether your profit-guarding decision holds
Using BTC in August, we track the rebound high breakout and subsequent BB contraction.
See the exit decision when you could not hold the breakout price
Check the moment when BTC on July 15 showed that buying rationale collapsed.
Understand why BB expands in pairs from the underlying mechanism
Explain the connection between short-term changes and long-term follow-through through BB calculations.
If you want to see a scenario where 1-hour and 15-minute expansions overlap,an example confirming GOLD resistance breakout with time-frame pairs. When price breaks the intended resistance, organize your entry basis and post-entry management.
If you also want to track short-term candle changes after holding,SILVER’s pair expansion and how to preserve profitsis recommended. It explains how to review holdings after a rise, using 15-minute candle contractions and the baseline line break.
Next time, we will compare the 15-minute and 1-hour candles and consider how to narrow down entry candidates.
Sources and data
The chart’s horizontal dashed line is a crosshair. It is not the resistance line drawn in the main text. The subsequent candles to the right of the target candles or the current value are not included as judgment material here.
Prices and BB come from TradingView’s KRAKEN:BTCUSD historical chart. Times are UTC, prices in USD, BB uses 20-period, SMA, closing price, and ±2σ. The width-change rate is a rough estimate calculated by dividing the target candle’s width by the previous candle’s width, then subtracting 1 to convert to a percentage. It differs from the BandWidth that divides by the middle line or from price’s rate of rise/fall or profit rate.
https://www.tradingview.com/widget-docs/widgets/charts/advanced-chart/
https://www.metatrader5.com/en/terminal/help/indicators/trend_indicators/bb
The charts are for retrospective use, and BB Watch records are not from the time. The actual measured time frames were the daily and the 4-hour charts, and the expansions for the 1-hour and 15-minute candles were not presented as observed at that time. The use of pairs is an example of how to apply in similar situations. Prices and BB values may differ depending on MT5 distributors. Trades are hypothetical and intended as examples; they do not reflect actual purchases at pullbacks or real performance. For actual trading, determine your loss tolerance before making decisions.