
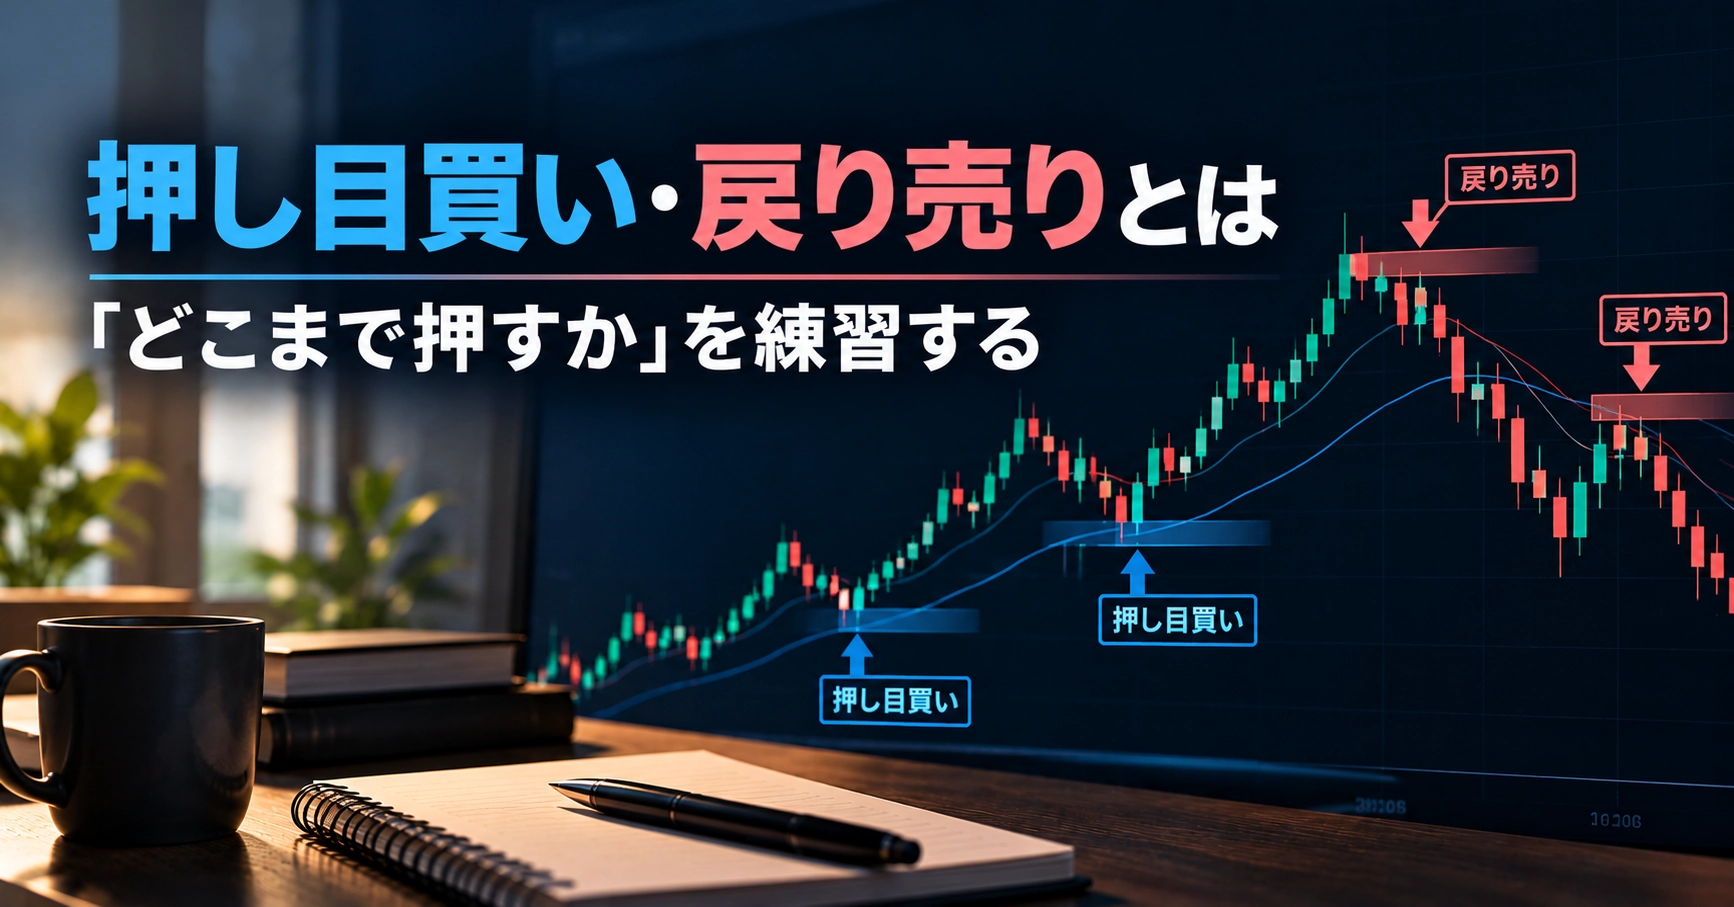
What is Dollar-Cost Averaging Buy and Reversal Sell — Practicing “how far to push down”
Introduction
In a rising market, I was waiting for a pullback. However, it went up without pulling back, and I missed out.
Unable to wait any longer, I entered and then was pushed down, leading to a stop-out. If you’ve ever tried buying on a dip, you may recognize both situations.
This article summarizes the concepts of buying on the dip and selling on a bounce, and how to practice to know “how far to wait.”
What you will understand from this article
- Concepts of buying on the dip and selling on the bounce
- Two common errors: waiting too long and waiting too early
- A step-by-step practice to develop the judgment of waiting
What are buying on the dip and selling on the bounce
In an uptrend, the price temporarily drops—that is called a dip (押し目). In a downtrend, the price temporarily rises—that is called a bounce (戻り).
Buying on the dip and selling on the bounce is theidea of “waiting for a temporary counter-move and then entering with the trend”concept.
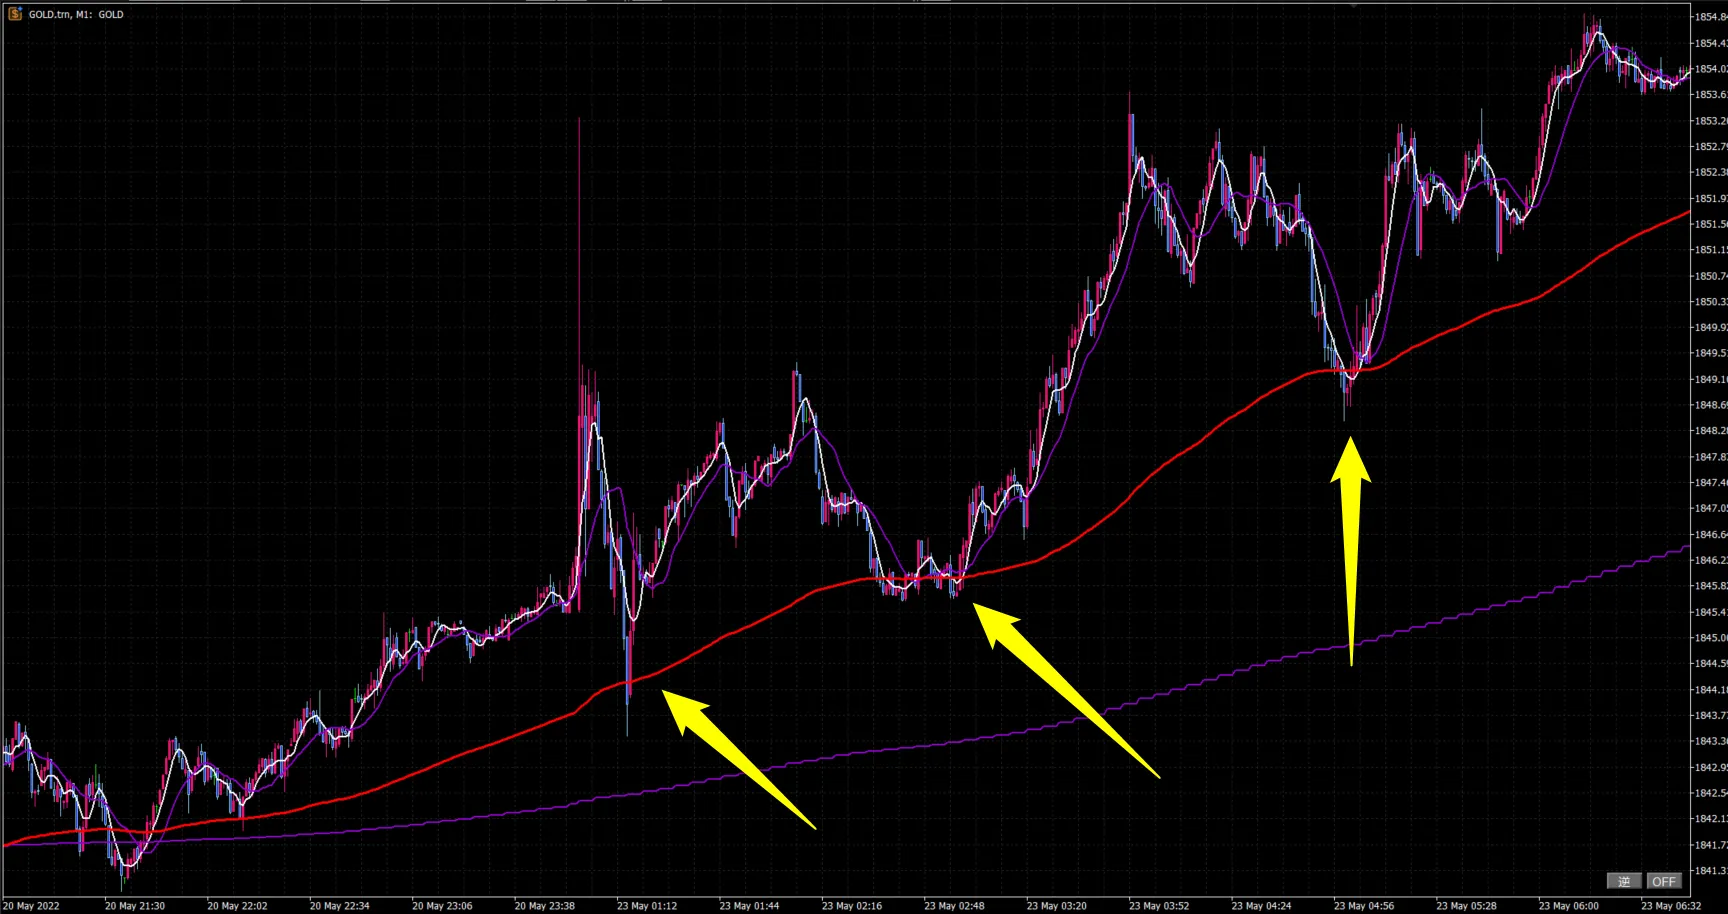
- In an uptrend, buy at the dip
- In a downtrend, sell at the bounce
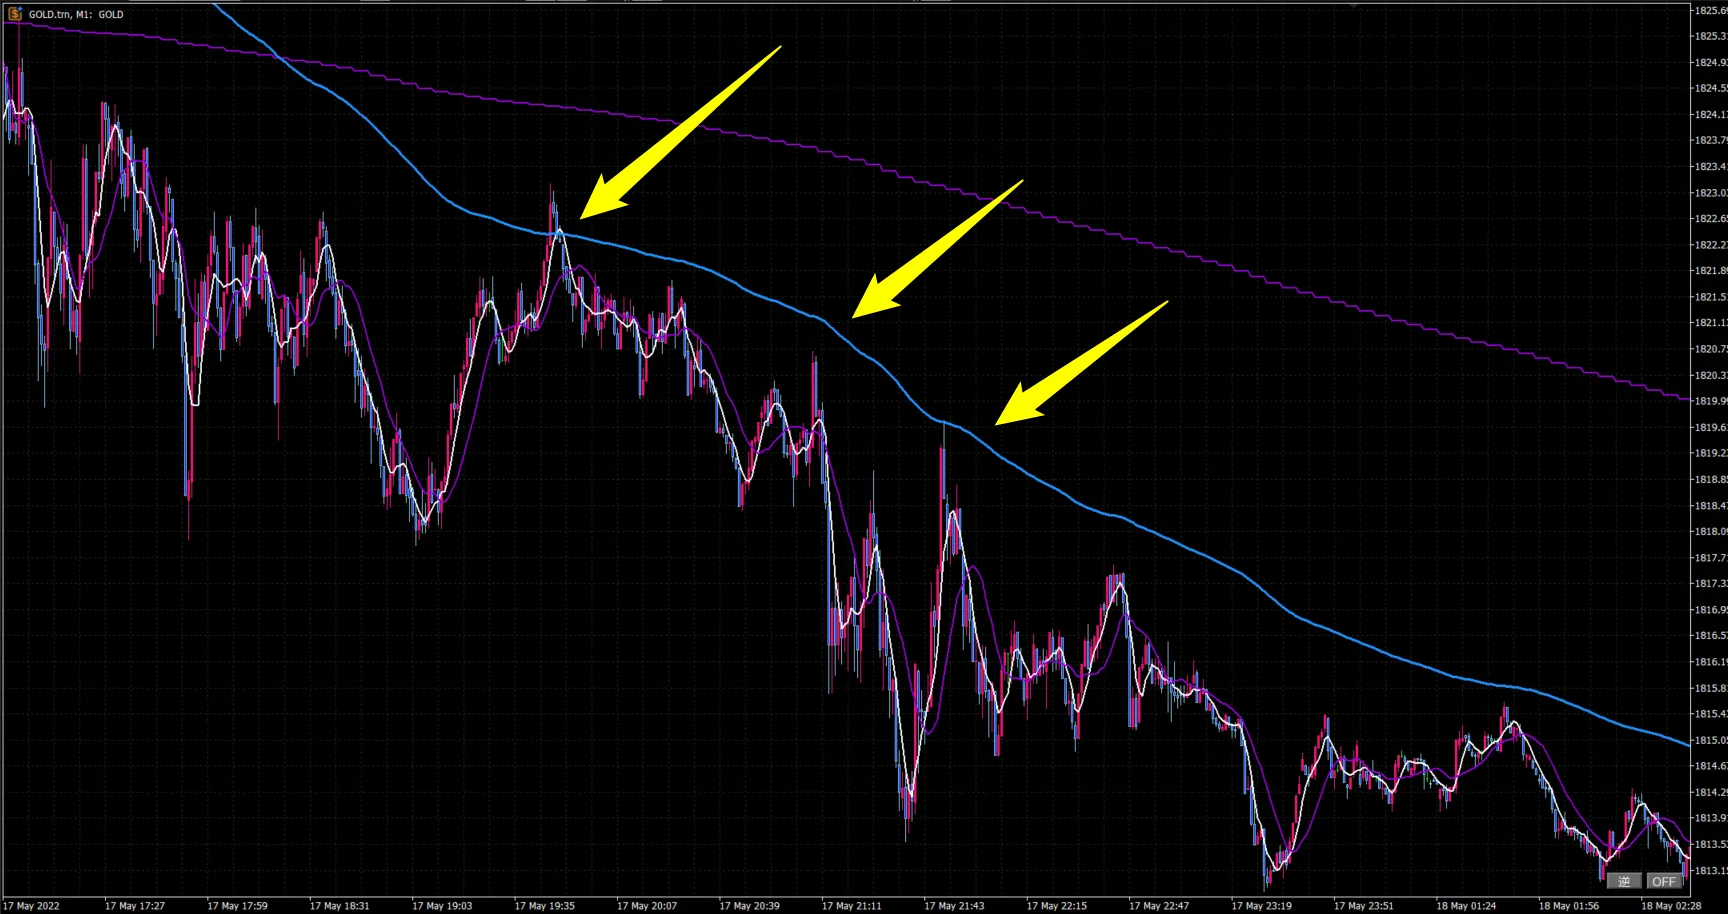
Because you enter in the direction of the trend, it’s easier to understand and less likely to jump in at a high point.
Two common mistakes
The difficulty of buying on the dip is thatyou cannot know where the dip ends at the moment. Therefore, there are two directions in which failures tend to occur.
- Waiting too long: You wait expecting it to drop further, but it rises without pulling back. You miss the move
- Waiting too early: You enter as the dip begins, and it then drops sharply. Sometimes the trend has already ended
Which occurs more often depends on the person. Once you know which bias you tend to have, you can clearly see what to focus on during practice.
Common reference points for “how far to wait”
When considering the depth of the dip, there are several commonly used reference points. None of them guarantee a turn, but they’re useful for practice.Practice material to verifyas you study.
- Previous highs and lows: See whether a previously breached high or low provides support when the price pulls back
- Moving averages: In the flow, whether the price returns to around the moving average
- Dip ratio: How far the pullback is from the previous rise (about halfway, etc.)
- Key levels on higher timeframes: Check whether the pullback on the lower timeframe hits the highs/lows or lines on the higher timeframe
Waiting judgment cannot be learned from knowledge alone
When you review past charts, the bottom of the dip is obvious at a glance. That’s becauseyou can see the price action after the dip has completed.
In real markets, you don’t know where it will stop while it’s pulling back. As you wait, candles accumulate one by one.
Decide, as each candle progresses, whether to wait further, enter now, or pass. This judgment only grows by seeing many situations where the outcome isn’t known in advance, and bycomparing your decision with the result.
The article below explains why practice with foresight isn’t effective in detail.
▶ Why seeing ahead of time doesn’t make practice effective — three situations where hindsight enters past analysishttps://www.gogojungle.co.jp/finance/navi/articles/126818
Steps to practice your waiting judgment
- Write down your rules for the dip: Which time frame you examine the trend on, how far it must pull back before you enter, what level you would pass on
- Pause at the moment you start to pull back, and write it down first: Entry position, conditions to pass, stop-loss location
- Advance candle by candle: Record whether you could enter, were left behind, or passed
- Mark results with a yes/no after the fact: Do not change the rules or positions you wrote first
- Observe how many scenarios occur to identify bias: Count whether waiting too long or waiting too early occurred more often
If you scroll the chart by hand to practice, the point where the pullback ended will appear on the right side of the screen. If you look at the answer first and then write, you won’t be able to follow steps 2 and 4.
Practice with tools
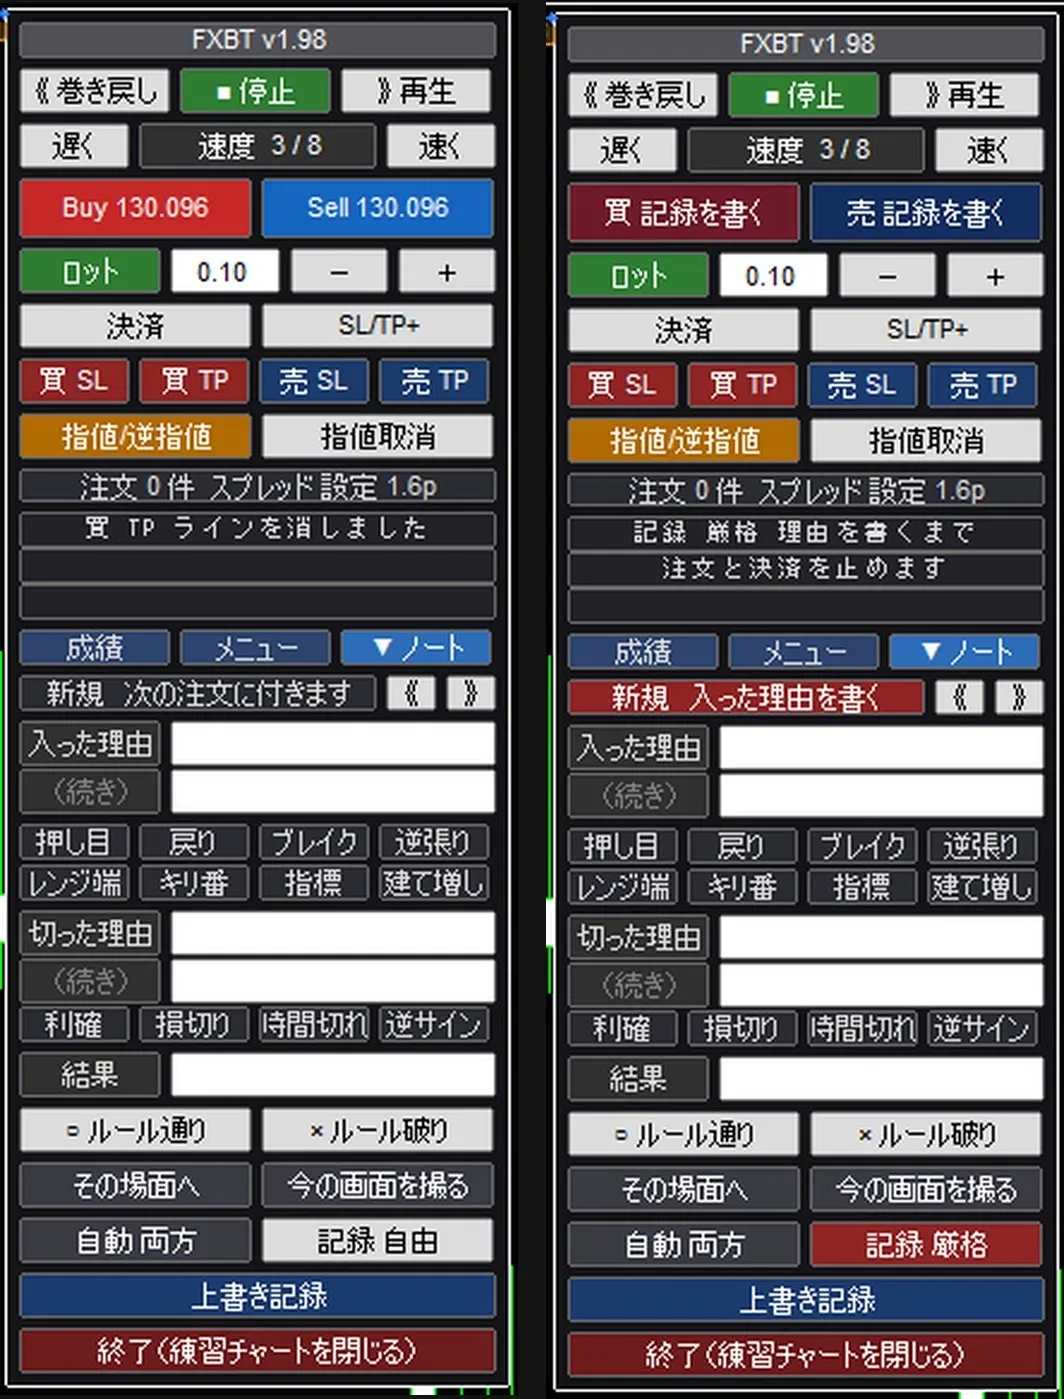
MT5 indicator “FX Historical Verification Trainer” is a practice tool that replays past charts one by one in a simulated account, allowing orders and recording for review.
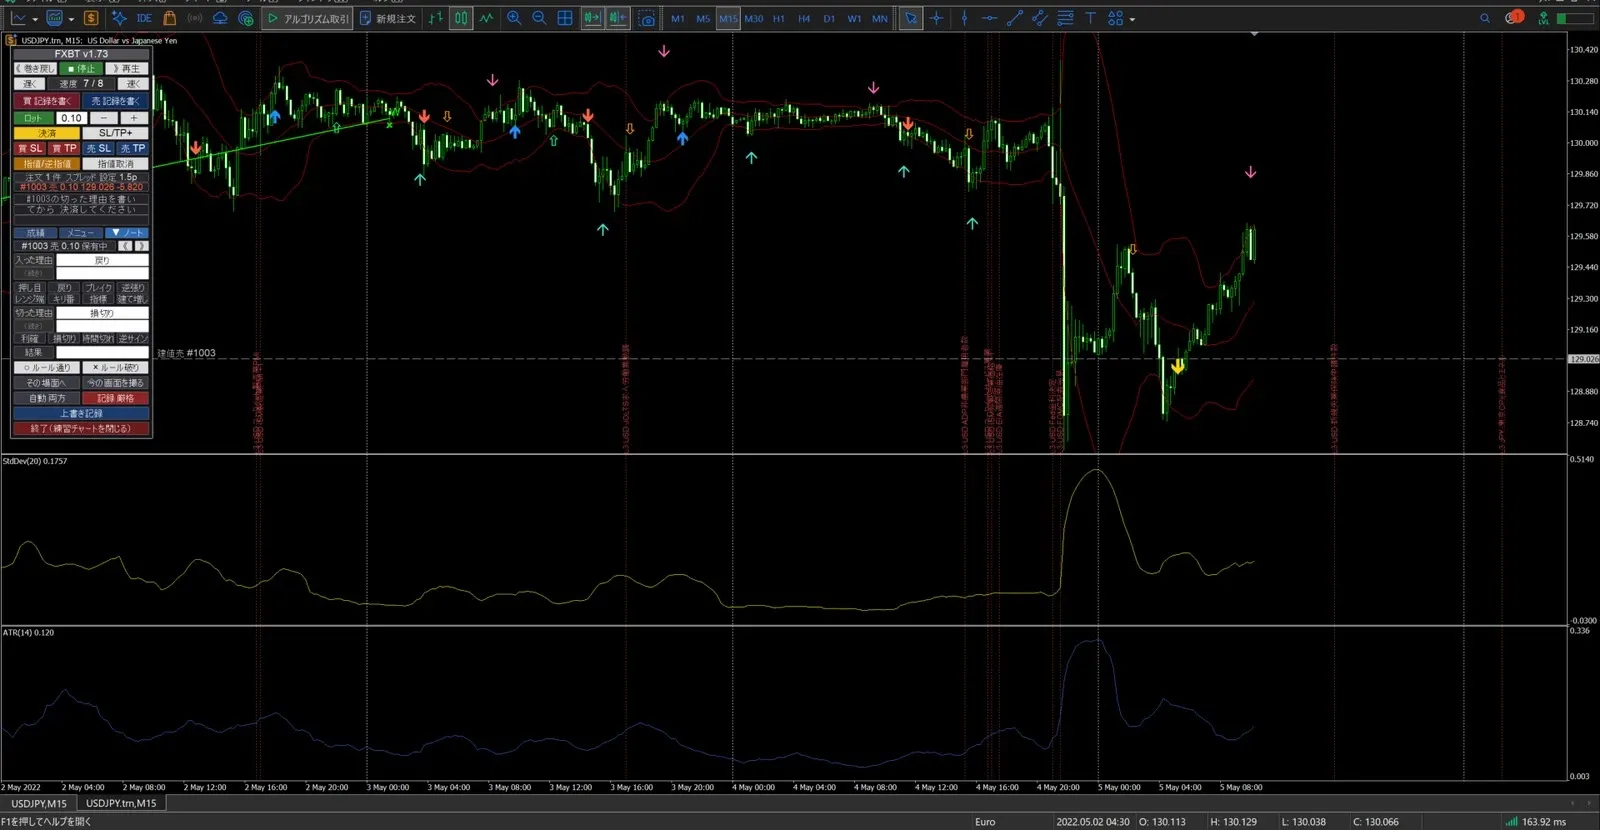
- The further candles do not exist as data, so you cannot see where the pullback ends until you replay
- With one-candle steps,you can watch the candle while pulling back and decide to wait or enter.
- You can place an order at a chosen price and wait. Stop loss and take profit are set by dragging lines on the chart
- You can arrange up to three higher-timeframe candles of the same pair side by side and move them at the same time. This allows judging while watching higher-timeframe key levels
- In the Trade Journal, you can record the reasons you entered. Later you can review by marking yes/no
There are things you cannot do.
- Commissions and swaps are not included in calculations. Movements finer than the minimum candle you set (default is 1-minute candles) are not replayed
- There is no built-in feature that tells you where the dip is. You decide yourself
- Account currency is only Japanese Yen, and the tool is available only for MT5 (Windows)
The procedure to practice with this tool on MT5 is summarized in another article.
▶ How to perform past verification where the future is not visible in MT5 — the pitfall of manual scrolling and practice with one-candle-by-one playbackhttps://www.gogojungle.co.jp/finance/navi/articles/126682
Summary
- Buying on the dip and selling on the bounce are the ideas of waiting for a temporary counter-move before entering in the direction of the trend
- Two common mistakes are “waiting too long” and “waiting too early.” The end of the dip cannot be known on the spot
- Write down your own rules, move candle by candle when you don’t know the future, and count which bias you have
Related articles
A method for determining the location of the stop loss based on where the reason for entry breaks down, and how to practice it.
▶ How to determine stop-loss location — place it at a justifiable level
https://www.gogojungle.co.jp/finance/navi/articles/127283
Seven common approaches used in discretionary trading, and the difficulties and practice points for each.
▶ Summary of representative discretionary trading methods — seven approaches and how to practice each
https://www.gogojungle.co.jp/finance/navi/articles/127390
Practice to differentiate the “fake-out” in breakouts when you don’t know the future.
▶ What is a breakout method — identifying fakes and how to practicehttps://www.gogojungle.co.jp/finance/navi/articles/127082
About the practice tools
The practice described in this article can be done with MT5 indicator “FX Historical Verification Trainer.” It is a tool for practicing by replaying past charts one by one, placing orders, recording, and reviewing in a simulated account.
There is a 7-day trial version.You can try all features without restrictions for 7 days.
First, confirm whether it runs on your MT5 and whether your usual indicators work.
▶ Trial version (Product ID 87387)
https://www.gogojungle.co.jp/tools/indicators/87387
If you want to continue practicing, see the product version.
Trade notes written in the trial version and saved verifications can be opened in the product version as well.
▶ Product version (Product ID 86765)
https://www.gogojungle.co.jp/tools/indicators/86765
Notes
- This tool is for practice. It does not guarantee profits. You cannot place real orders.
- This article introduces practice methods. It does not promote specific trading or strategies.